2018 State of the Health Funds Report
Private Health Insurance Ombudsman State of the Health Funds Report 2018
Relating to the financial year 2017–18
Report required by 20D (c) of the Commonwealth Ombudsman Act 1976.
This work is copyright. Apart from any use permitted under the Copyright Act 1968, no part may be reproduced without written permission. Requests concerning reproduction and rights should be addressed to the Commonwealth Ombudsman © Commonwealth of Australia 2019.
FOREWORD

I am pleased to present the 14th annual State of the Health Funds Report, relating to the financial year 2017–18. The report provides comparative information on the performance and service delivery of all health funds1 during the financial year.
The information in the report supplements information available on our consumer website privatehealth.gov.au. The consumer website provides a range of information to assist consumers to understand private health insurance, and to select or update their private health insurance policies. The information on the consumer website, together with the State of the Health Funds Report, assists consumers to choose health insurance policies that better meet their individual needs.
The purpose of this report is to provide consumers with additional information to assist them to make decisions about private health insurance. For existing policyholders, the report details information that allows them to compare the performance of their fund with all other health funds. For those considering taking out private health insurance for the first time, the report provides an indication of the services available from each fund and a comparison of some service and performance indicators at the fund level.
The range of issues and performance information contained in the report has been chosen after taking into account the availability of reliable data and whether the information is reasonably comparable across funds. The information included in the report is based on data collected by the Australian Prudential Regulation Authority (APRA), as part of its role in undertaking statistical reporting and monitoring of the financial management of health funds. I would like to thank APRA for their assistance and advice in relation to the report.

Mr Michael Manthorpe PSM
Commonwealth Ombudsman
March 2019
CONTENTS
- Foreword
- Using this report to compare funds
- About the data used in this report
- Key consumer issues
- Health fund listing and contact details
- Service Performance
- Hospital
- Medical gap schemes
- General treatment (extras)
- Finances and costs
- Health fund operations by state or territory
- About the Private Health Insurance Ombudsman
- What happens after I make a complaint?
- Ten tips for avoiding health insurance problems
List of Figures
- Figure 1 — Total complaint and enquiries by year
- Figure 2 — Complaint issues over previous three years
- Figure 3 — privatehealth.gov.au visitors per year
List of Tables
- Table 1 — Health funds listing and contact details
- Table 2A — Membership retention and complaints (greater than 0.5 per cent market share)
- Table 2B — Smaller funds (less than 0.5 per cent national market share)
- Table 3 — Hospital
- Table 4A — Medical services with no gap
- Table 4B — Medical services with no gap or where known gap payment made
- Table 5A — General treatment (extras)
- Table 5B — General treatment (extras)
- Table 6 — Finances and costs
- Table 7A — New South Wales
- Table 7B — Victoria
- Table 7C — Queensland
- Table 7D — South Australia
- Table 7E — Western Australia
- Table 7F — Tasmania
- Table 7G — Australian Capital Territory
- Table 7H — Northern Territory
USING THIS REPORT TO COMPARE FUNDS
Disclaimer:
- Nothing contained in this report should be taken as a recommendation by the Ombudsman in favour of any particular health fund or health insurance policy.
- No single indicator should be used as an indicator of overall fund performance. In most cases, seemingly poor performance on one indicator will be offset by good performance on other factors.
- The information used in this report to compare health funds is based on data collected for regulatory purposes. This information is the most appropriate, independent and reliable data available.
- This report is intended to help consumers decide which health funds to consider, though it will not necessarily indicate which of the fund's policies to purchase. Virtually all funds offer more expensive policies that can be expected to provide better than average benefits as well as cheaper policies that provide less.
The State of the Health Funds Report
The State of the Health Funds Report (SOHFR) compares how health funds perform across the following criteria:
- service performance
- hospital benefits
- medical gap schemes
- general treatment (extras) benefits
- financial management
- health fund operations.
You can use the information contained in this report to identify possible funds to join, or to assess your existing fund's performance if you're reviewing your current needs.
You can use the range of indicators included in this report as a menu to choose the factors of most importance to you—not all factors will be of equal importance to every individual or family.
For instance, if you prefer to do business with a health fund in person, then you should consider the availability of retail offices to be an important consideration. More information about particular indicators is provided in the explanations preceding each of the tables in this report.
If you are considering taking out private health insurance for the first time, we suggest you use the report to identify a number of funds—preferably at least three—for further investigation.
Where to find more information about selecting a policy
Our brochure 'Health Insurance Choice: Selecting a Health Insurance Policy' includes important advice on what factors to consider and what questions to ask when selecting a policy. It also includes information on government incentives relating to hospital cover such as the 'Medicare Levy Surcharge Exemption' and 'Lifetime Health Cover'.
This brochure, as well as other publications, can be found at ombudsman.gov.au. Some brochures can be obtained in hard copy on request from our Office.
This report does not include detailed information on price and benefits for health insurance policies. Information on specific policies is available from the Ombudsman's consumer website privatehealth.gov.au, where you can search for and compare information about every health fund and policy in Australia.
Fund names
Throughout this report, health funds are referred to by an abbreviation of their registered name, rather than any brand name that they might use. This abbreviated name appears on the left side of the heading for each fund in the Health Fund Listing section. Some funds use several different brand names:
| Brand name | Fund |
|---|---|
| AAMI | NIB |
| APIA | NIB |
| Australian Country Health | Medibank |
| Australian Health Management | Medibank |
| Budget Direct | GMHBA |
| Country Health | Medibank |
| CY Health | HBF |
| Druids | GMHBA |
| Federation Health | Latrobe |
| FIT | GMHBA |
| Frank | GMHBA |
| GMF Health | HBF |
| Goldfields | HBF |
| Government Employees | Medibank |
| Grand United | Australian Unity |
| HBA | BUPA |
| Healthguard | HBF |
| Hunter Health Insurance | CDH |
| Illawarra Health Fund | Medibank |
| IOOF | NIB |
| IOR | HCF |
| Kogan | Medibank |
| Manchester Unity | HCF |
| MBF | BUPA |
| Mutual Community | BUPA |
| Mutual Health | Medibank |
| NRMA Health | BUPA |
| Qantas Assure | NIB |
| RACT | GMHBA |
| Suncorp | NIB |
| SGIC (SA) | BUPA |
| SGIO (WA) | BUPA |
| Unihealth | Teachers Health |
| Union Health | TUH |
ABOUT THE DATA USED IN THIS REPORT
Open and restricted membership health funds
Membership of 'open' health funds is available to everyone.
'Restricted membership' health funds have certain membership criteria which mean they are not available to all consumers. For example, membership may be restricted to employees of certain companies or occupations, or members of particular organisations.
Where applicable, open and restricted membership funds are listed separately in each of the tables in this report.
Information about policies
The information included in the report on fund contributions and benefits indicates the average outcomes across all of a fund's policies, so cannot be taken as an indicator of the price or benefit levels that can be expected for any particular policy.
Virtually all funds offer more expensive policies that can be expected to provide better than average benefits and most also offer cheaper policies that provide less.
This report can help you to decide which health funds to consider, but won't necessarily help you to decide which of the funds' policies to purchase.
For information about specific policies, the website privatehealth.gov.au enables you to view standard information outlining the main features of any health insurance policy. You can compare Private Health Information Statements for any policy available for purchase from any fund, including the level of cover, excess and price. The website is Australia's leading source for independent and reliable information about private health insurance.
Data collection
The need to obtain independent and reliable data has been a key consideration in preparing this report. The data selected by the Ombudsman as the most appropriate available is collected by the industry regulator, the Australian Prudential Regulation Authority (APRA). APRA has supplied most of the data published in this report.
Funds report to APRA for regulatory purposes and not all of the data is publicly available. Some of this information is useful to consumers and is therefore reproduced in this report. You should note that the data is collected primarily for regulatory purposes and not for the purposes of the SOHFR. It is important to read the accompanying text explaining the data in conjunction with the tables.
As funds differ in size, most of the statistical information is presented as percentages or dollar amounts per membership, for easier comparison. No attempt has been made to weight the importance of various indicators, as these are subjective judgements which are dependent on individual circumstances, preferences and priorities.
The report provides additional information about the benefits that were paid by each fund over the last year. The report also provides information about the extent of cover provided for hospital, medical and general treatment, and any state-based differences in coverage. The selection of indicators used in this report are not intended to represent the full range of factors that should be considered when comparing the performance of health funds. The range of indicators has been limited to those where there is reliable comparative information available.
KEY CONSUMER ISSUES
Complaint issues in 2017–18
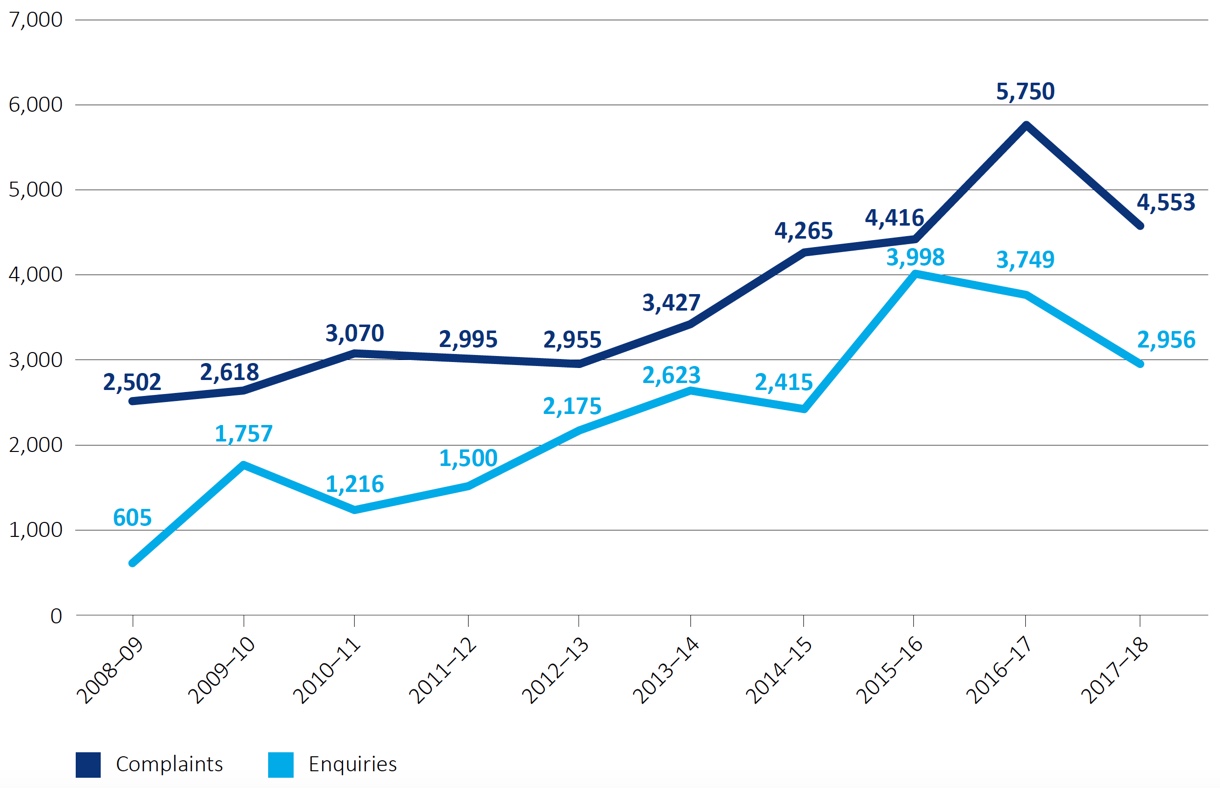
In 2017–18 private health insurance complaints to our Office declined 21 per cent to 4,553, which was a significant reduction compared to 5,750 in 2016–17. Our Office's private health insurance complaint workload over the past 10 years is shown in Figure 1.
The number of private health insurance complaints received has increased significantly over the last decade. In 2016–17, we received 5,750 complaints, compared to 4,416 in the previous year – an increase of over 1,300 complaints. This was the largest increase we have experienced over the past 10 years. Although complaints have moderated in 2017–18, there remains a steady increase in trend terms.
The number of consumer information enquiries received by the Office relating to private health insurance reduced by 21 per cent in 2017-18. We received 2,956 enquiries, of which 65 per cent were received through the consumer website privatehealth.gov.au.
Figure 1 — Total complaint and enquiries by year
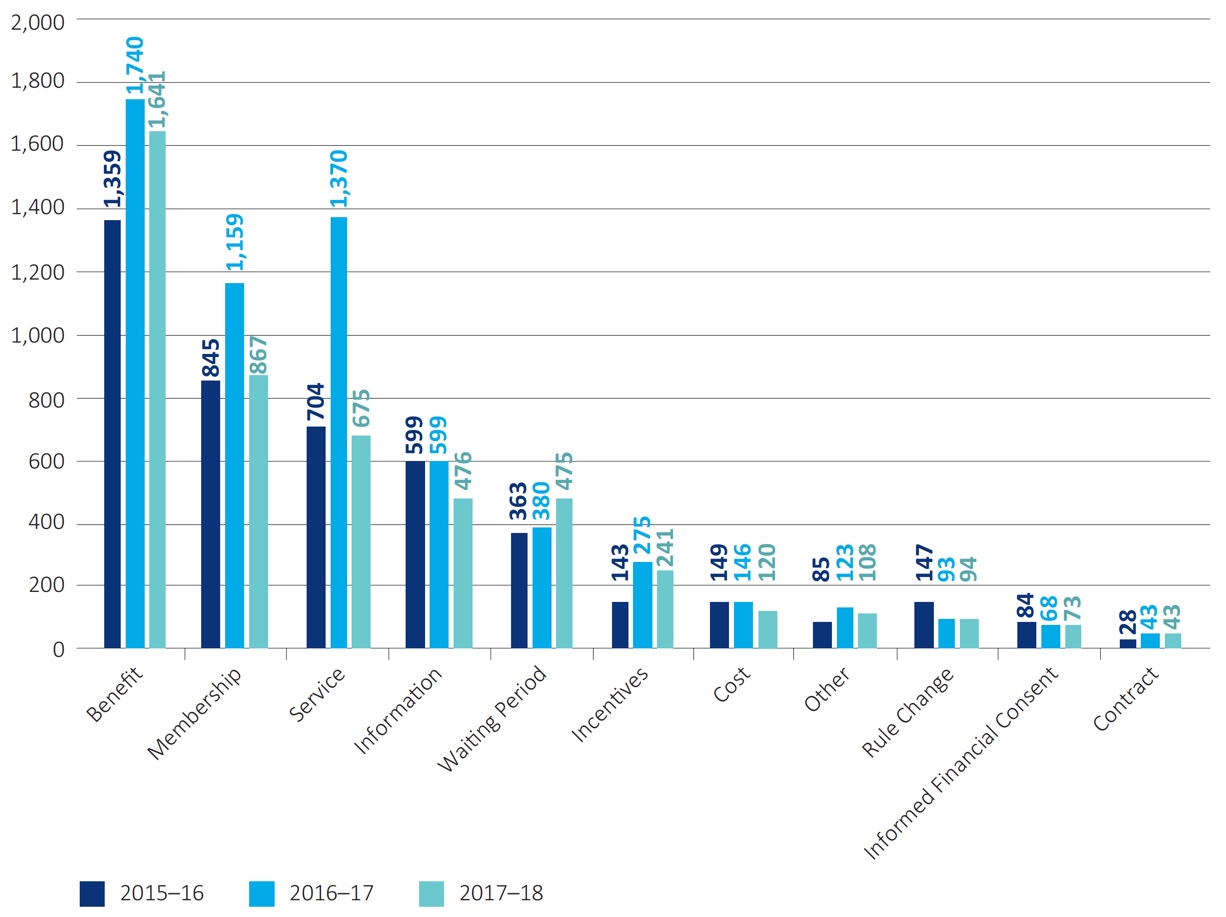
The top three complaint issues to our Office continued to be Benefits, Membership and Service.
For Benefit complaints, the main issue of concern was hospital policies with unexpected exclusions and restrictions. Some basic and budget levels of hospital cover exclude or restrict services that many consumers assume are routine treatments or standard items. The Office anticipates that the number of complaints about benefits will reduce significantly in future years with the implementation of private health insurance reforms in 2019, which will standardise clinical categories and give consumers more certainty about their benefits.
Delays in benefit payments and complaints about insurer rules that limited benefits also represented a significant proportion of complaints received.
Membership complaints typically related to policy administration issues, such as processing cancellations or payment of premium arrears. Delays in the provision of transfer (also known as clearance) certificates when transferring between health insurers was also a significant cause of complaint.
Service issues are usually not the sole reason for complaints and a service failure is often part of any complaint made to an external body like an Ombudsman. The combination of unsatisfactory customer service, untimely responses to simple issues and poor internal escalation processes can cause policy-holders to become more aggrieved and dissatisfied in their dealings with the insurer. The service itself then becomes a cause of complaint as well as the original issue. Notably, Service complaints dropped in volume from 2016–17, when ICT problems at one insurer caused a spike in complaints to our Office.
Figure 2 — Complaint issues over previous three years
Consumer website privatehealth.gov.au
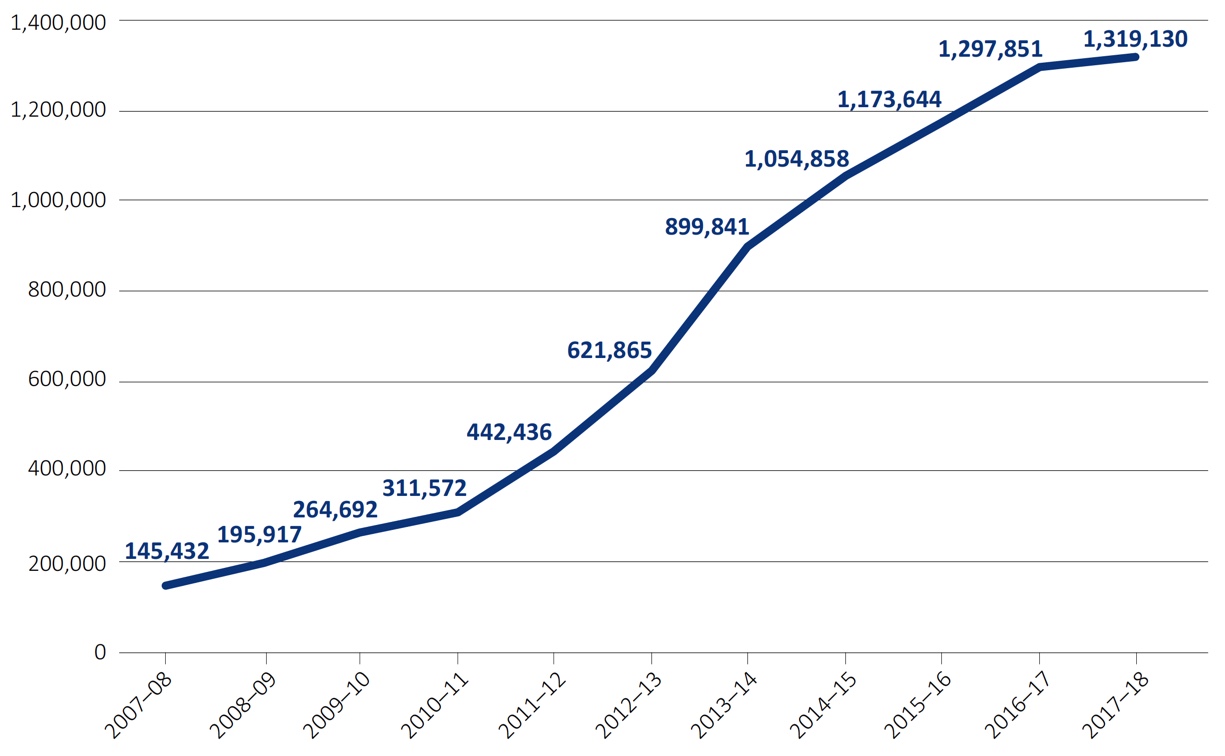
In 2017–18 we received 1,924 individual enquiries via the consumer website privatehealth.gov.au. We responded to these enquiries with written consumer information and advice. The website is Australia's leading source of independent information about health insurance for consumers.
Website usage has continued to grow annually since the website's launch in 2007, with 1,319,130 visits in 2017–18.
Figure 3 — privatehealth.gov.au visitors per year
Private health insurance reforms
In 2017, the Government announced significant reforms to health insurance. A key aim of the reforms is to make health insurance simpler for consumers to understand by introducing common health insurance terms and classifying policies into simpler categories. The consumer website privatehealth.gov.au is being redeveloped as part of the reforms.
The major changes in these health insurance reforms are summarised below. For further information, please see health.gov.au/private-health-reforms.
Gold, Silver, Bronze and Basic hospital cover
Health insurers will begin rolling out four new tiers of hospital cover from early 2019. The four tiers of Gold, Silver, Bronze and Basic each have minimum inclusions and will become mandatory from 1 April 2020.
Private health insurers have one year, from 1 April 2019, to introduce these new tiers. Insurers have commenced informing consumers with existing health insurance policies about how their policies will change or have changed to fit into one of the new tiers.
Clinical categories
What is, and is not, covered in the Gold, Silver, Bronze and Basic tiers will be based on new standard clinical categories of treatment. These standard clinical categories are groups of hospital treatments that are covered under each policy. Each standard clinical category—for example, 'bone, joint and muscle' category, or 'heart and vascular system' category—sets out the hospital treatments that must be covered by the private health insurer. If a policy covers a certain category, then it must cover everything included in the category.
Private Health Information Statement (PHIS)
Insurers are required to send consumers a statement summarising what their policy covers at least once a year, and again each time their policy changes.
From 2019 onwards, policy information for new Gold, Silver, Bronze or Basic hospitals and new general treatment policies will be provided in the form of a Private Health Information Statement (PHIS) including information about what is covered based on the new tiers and clinical categories of treatment. From 1 April 2020, all policies will be summarised in PHIS documents.
Consumers can search for and compare a standard PHIS from every insurer in Australia on privatehealth.gov.au. Insurers can also offer a customised PHIS for their members and in their emails, letters and websites, which may include further information.
Mental health treatment waiting periods
Since 1 April 2018, health insurers have been providing greater access to mental health services by allowing people to upgrade their hospital cover without serving the usual two month waiting period for in-hospital psychiatric treatment. Policyholders are able to use this exemption from the usual waiting period on a once-off basis.
Natural therapies
From 1 April 2019, private health insurers will no longer be able to offer benefits for some natural therapies as part of a health insurance policy.
The affected natural therapies are Alexander technique, aromatherapy, Bowen therapy, Buteyko, Feldenkrais, western herbalism, homeopathy, iridology, kinesiology, naturopathy, Pilates, reflexology, Rolfing, shiatsu, tai chi, and yoga.
Discounts for 18–29 year olds
From 1 April 2019, insurers will have the option to offer people aged 18–29 years discounts of up to 10 per cent of their private health insurance hospital premiums. People will retain that discount until they turn 41, when it will be gradually phased out.
Travel and accommodation benefits for rural consumers
Insurers will have the option to offer travel and accommodation benefits as part of hospital cover for consumers that need to travel away from home for treatment. Some insurers already offer these benefits to their members under general treatment or extras cover.
Additional Ombudsman's powers
In addition to its current complaint-handling and information provision roles, our Office has new powers to inspect private health insurers to address complaints when they cannot be resolved through the usual channels.
HEALTH FUND LISTING AND CONTACT DETAILS
The following tables list all Australian registered health funds. The 'open' membership funds provide policies to the general public. The 'restricted' funds provide policies only through specific employment groups, professional associations or unions.
| Open Membership Health Funds | |||
|---|---|---|---|
| Abbreviation | Full name or other names | Phone Number | Website |
| Australian Unity | Australian Unity Health Ltd | 132 939 | australianunity.com.au |
| BUPA | Bupa HI Pty Ltd | 134 135 | bupa.com.au |
| CBHS Corporate | CBHS Corporate Health Pty Ltd | 1300 586 462 | cbhscorporatehealth.com.au |
| CDH | CDH – Hunter Health Insurance | 02 4990 1385 | hunterhi.com.au |
| CUA Health | CUA Health Ltd | 1300 499 260 | cua.com.au/health |
| GMHBA | GMHBA Ltd, Frank | 1300 446 422 | gmhba.com.au |
| GU Health Corporate | Grand United Corporate Health | 1800 249 966 | guhealth.com.au |
| HBF | HBF Health Ltd | 133 423 | hbf.com.au |
| HCF | Hospitals Contribution Fund of Australia | 131 334 | hcf.com.au |
| HCI | Health Care Insurance Ltd | 1800 804 950 | hciltd.com.au |
| Health.com.au | Health.com.au | 1300 199 802 | health.com.au |
| Health Partners | Health Partners Ltd | 1300 113 113 | healthpartners.com.au |
| HIF | Health Insurance Fund of Australia Ltd | 1300 134 060 | hif.com.au |
| Latrobe | Latrobe Health Services | 1300 362 144 | latrobehealth.com.au |
| MDHF | Mildura Health Fund Ltd | 03 5023 0269 | mildurahealthfund.com.au |
| Medibank | Medibank Private Ltd, Australian Health Management |
132 331; 134 246 | medibank.com.au; ahm.com.au |
| MO Health | MyOwn Health Insurance | 1300 300 338 | myown.com.au |
| NIB | NIB Health Funds Ltd, Qantas Assure, APIA | 131 463 | nib.com.au |
| Onemedifund | National Health Benefits Australia Pty Ltd | 1800 148 626 | onemedifund.com.au |
| Peoplecare | Peoplecare Health Insurance Limited | 1800 808 690 | peoplecare.com.au |
| Phoenix | Phoenix Health Fund Ltd | 1800 028 817 | phoenixhealthfund.com.au |
| QCH | Queensland Country Health Fund Ltd | 1800 813 415 | qldcountryhealth.com.au |
| St Lukes | St. Lukes Health | 1300 651 988 | stlukes.com.au |
| Transport Health | Transport Health Pty Ltd | 1300 806 808 | transporthealth.com.au |
| Westfund | Westfund Limited | 1300 937 838 | westfund.com.au |
| Restricted Membership Health Funds | |||
| Abbreviation | Full name or other names | Phone Number | Website |
| ACA | ACA Health Benefits Fund | 1300 368 390 | acahealth.com.au |
| CBHS | CBHS Health Fund Ltd | 1300 654 123 | cbhs.com.au |
| Defence Health | Defence Health Ltd | 1800 335 425 | defencehealth.com.au |
| Doctors' Health | The Doctors' Health Fund | 1800 226 126 | doctorshealthfund.com.au |
| Emergency Services | Emergency Services Health Pty Ltd | 1300 703 703 | eshealth.com.au |
| Navy | Navy Health Ltd | 1300 306 289 | navyhealth.com.au |
| Nurses and Midwives | Nurses and Midwives Health Pty Ltd | 1300 344 000 | nmhealth.com.au |
| Police Health | Police Health | 1800 603 603 | policehealth.com.au |
| Reserve Bank | Reserve Bank Health Society Ltd | 1800 027 299 | myrbhs.com.au |
| RT Health Fund | Railway and Transport Health Fund Ltd | 1300 886 123 | rthealthfund.com.au |
| Teachers Health | Teachers Health Fund | 1300 728 188 | teachershealth.com.au |
| TUH | Teachers' Union Health Fund | 1300 360 701 | tuh.com.au |
SERVICE PERFORMANCE
The level of complaints that the Ombudsman receives about a fund, relative to its market share, is a reasonable indicator of the service performance of most funds.
Whether a fund can attract new members and, more importantly, retain members is also an indicator of member satisfaction.
Member retention
The member retention indicator is used as one measure of the comparative effectiveness of health funds and their level of member satisfaction. This indicator measures what percentage of fund members (hospital memberships only) have remained with the fund for two years or more.
This figure is calculated on the total gain or loss of members over the last two years, which takes into account consumers who take up membership and leave within that two year period. Figures are not adjusted for policies that lapse when a member dies, as these are not reported to APRA.
Most restricted membership funds rate well on this measure compared to open membership funds. This may be due to the particular features of restricted membership funds, especially their links with employment.
Membership change
The membership change indicator shows the change in the number of policy holders over the year from 30 June 2017 to 30 June 2018. Both the percentage change and number are included. Negative figures indicate that the fund has experienced a net reduction in membership over the period. Member deaths would contribute to this figure, as these are not reported separately to APRA.
Ombudsman complaints in context
The number of complaints received by the Ombudsman is very small compared to fund membership.
There are a number of factors (other than service performance) that can influence the level of complaints the Ombudsman receives about a fund. These include the information provided to fund members about the Ombudsman through general publicity or by the fund, and the effectiveness of the fund's own complaint-handling process.
Complaints percentage compared to market share percentage
Table 2A (on page 16) includes all funds with a national market share of 0.5 per cent or more.
In that table each fund's market share (as at 30 June 2018) is shown in the market share column. Subsequent columns show the percentage of Ombudsman complaints in various categories, received about each fund. These percentages should be compared with the market share percentage. If a fund has a higher complaints percentage than its market share, it indicates that members of that fund are more likely to complain than the average of all fund members.
The table also indicates what percentage of Benefit and Service complaints are received about each fund.
Benefit complaints include problems of non-payment, delayed payment, the level of benefit paid or the gap paid by the member.
Service complaints are about the general quality of service provided by fund staff, the quality of customer service advice and premium payment problems.
All complaints takes account of all complaints received by the Ombudsman about the fund. They include complaints investigated as well as complaints that were finalised without the need for investigation.
Complaints investigated is a measure of how many complaints required a higher level of intervention from the Ombudsman. Most complaints to the Ombudsman can be finalised by referring the matter to fund staff to resolve, or by the Ombudsman staff providing information to the complainant. Complaints which fund staff have not been able to resolve to a member's satisfaction are investigated by the Ombudsman's Office—so the rating on complaints investigated is an indicator of the effectiveness of each fund's own internal complaints-handling.
Smaller funds (less than 0.5 per cent national market share)
For these smaller funds, it is not practical to show the percentage of complaints in each of the above categories because of the very small numbers of complaints.
Table 2B (on page 17) therefore shows the actual number of all complaints received and the number of complaints investigated, as well as whether the number is below the number expected based on the fund's market share.
While these funds have a very low national market share, many are nevertheless very significant in a particular state or region.
Code of Conduct
The self-regulatory code for health funds deals with the quality of advice provided to consumers and sets standards for training of health fund staff and others responsible for advising consumers about private health insurance. It also requires funds to have effective complaint-handling procedures. Funds that have completed the compliance processes for becoming a signatory to the code are indicated in the table (as at January 2019).
For more information about the Code of Conduct, please see: privatehealthcareaustralia.org.au/codeofconduct/
| Fund Name (Abbreviated) | Member retention (hospital cover) [1] | Membership change % (number) [2] | Market share | Complaints % compared to market share % | Code of conduct member | |||
|---|---|---|---|---|---|---|---|---|
| Benefits | Service | All complaints | Complaints investigated | |||||
| Open membership funds | ||||||||
| Australian Unity | 77% | -4.2% (8,337) | 2.9% | 4.7% | 3.9% | 5.4% | 5.9% | Yes |
| BUPA | 83% | -1.9% (34,306) | 26.3% | 18.5% | 17.2% | 23.5% | 30.8% | Yes |
| CUA Health | 72% | -3.7% (1,472) | 0.6% | 0.9% | 0.4% | 0.7% | 1.1% | Yes |
| GMHBA | 72% | 5.3% (7,915) | 2.4% | 2.8% | 3.0% | 3.0% | 2.5% | Yes |
| HBF | 85% | -1.8% (9,538) | 7.8% | 4.8% | 3.7% | 7.0% | 4.9% | Yes |
| HCF | 85% | 3.1% (21,383) | 10.7% | 11.0% | 11.1% | 14.8% | 15.9% | Yes |
| Health.com.au | 70% | 0.3% (131) | 0.6% | 1.1% | 0.9% | 1.0% | 3.0% | No |
| Health Partners | 88% | 3.2% (1,327) | 0.6% | 0.5% | 0.3% | 0.3% | 0.6% | Yes |
| HIF | 72% | -3.6% (2,051) | 0.8% | 0.9% | 0.7% | 0.8% | 0.8% | Yes |
| Latrobe | 73% | -2.0% (879) | 0.7% | 0.3% | 0.6% | 0.5% | 0.0% | Yes |
| Medibank | 81% | 0.3% (4,813) | 26.9% | 18.5% | 29.5% | 24.4% | 12.5% | Yes |
| NIB | 78% | 3.0% (16,375) | 8.5% | 9.8% | 6.1% | 9.2% | 10.8% | Yes |
| Peoplecare | 77% | 1.3% (446) | 0.5% | 0.3% | 0.1% | 0.5% | 0.4% | Yes |
| Westfund | 81% | 7.3% (3,203) | 0.7% | 0.3% | 0.1% | 0.2% | 0.2% | Yes |
| Restricted membership funds | ||||||||
| CBHS | 92% | 3.0% (2,857) | 1.5% | 1.6% | 0.9% | 1.4% | 1.5% | Yes |
| Defence Health | 89% | 5.0% (6,648) | 2.1% | 1.3% | 1.0% | 1.3% | 1.3% | Yes |
| Teachers Health | 92% | 5.0% (7,485) | 2.4% | 2.7% | 1.3% | 2.0% | 3.2% | Yes |
| TUH | 83% | 1.8% (678) | 0.6% | 0.5% | 0.1% | 0.4% | 0.4% | Yes |
[1] The total gain or loss of members over the last two years, which takes into account consumers who take up membership and leave within that two year period.
[2] The industry experienced a growth of 0.55 per cent or 36,168 memberships overall.
| Fund Name (Abbreviated) | Member retention (hospital cover) | Membership change [1] % (number) | Number complaints Received | Below market share? | Number complaints investigated | Below market share? | Code of conduct member |
|---|---|---|---|---|---|---|---|
| Open membership funds | |||||||
| CBHS Corporate | n/a | 282% (595) | 0 | Yes | 0 | Yes | No |
| CDH | 89% | 0.2% (6) | 1 | Yes | 1 | No | No |
| GU Health Corporate | 66% | 0.7% (194) | 35 | No | 4 | No | Yes |
| HCI | 84% | 7.3% (452) | 8 | No | 0 | Yes | Yes |
| MDHF | 88% | 2.4% (364) | 2 | Yes | 1 | Yes | No |
| MO Health | n/a | n/a | 0 | Yes | 0 | Yes | No |
| Onemedifund | 92% | 1.6% (91) | 0 | Yes | 0 | Yes | Yes |
| Phoenix | 84% | 9.1% (763) | 11 | No | 3 | No | Yes |
| QCH | 85% | 9.1% (2,199) | 3 | Yes | 0 | Yes | Yes |
| St Lukes | 88% | 6.5% (1,948) | 8 | Yes | 0 | Yes | Yes |
| Transport Health | 69% | -16.5% (1,349) | 15 | No | 1 | No | Yes |
| Restricted membership funds | |||||||
| ACA | 92% | 0.2% (12) | 0 | Yes | 0 | Yes | Yes |
| Doctors' Health | 88% | 16.1% (2,665) | 8 | Yes | 3 | No | Yes |
| Emergency Services | n/a | 283.5% (499) | 0 | Yes | 0 | Yes | No |
| Navy Health | 88% | 4.9% (1,001) | 5 | Yes | 1 | Yes | Yes |
| Nurses and Midwives | n/a | 270.8% (2,283) | 3 | No | 0 | Yes | No |
| Police Health | 91% | 4.1% (879) | 5 | Yes | 0 | Yes | Yes |
| Reserve Bank | 89% | -1.1% (27) | 2 | No | 0 | Yes | Yes |
| RT Health Fund | 87% | 6.0% (1,406) | 27 | No | 5 | No | Yes |
[1] The industry experienced a growth of 0.55 per cent or 36,168 memberships overall.
Note: 'n/a' indicates no data as insurer commenced operations during 2017–18.
HOSPITAL
Table 3 provides a general comparison of health insurance for private hospital treatment. A higher percentage indicates that, on average, the fund's members are covered for a higher proportion of hospital charges.
It's important to remember most funds offer a choice of different policies—the percentages indicated in this table are not indicative of any single policy, but are an average of all policies offered by the fund.
Hospital policies
Table 3 provides a general comparison of health insurance for private hospital treatment (hospital policies) provided by each fund.
Hospital policies provide benefits towards the following costs if you elect to be a private patient in a private or public hospital:
- hospital fees for accommodation, operating theatre charges and other charges raised by the hospital
- the costs of drugs or prostheses required for hospital treatment
- fees charged by doctors (surgeons, anaesthetists, pathologists, etc.) for in-hospital treatment.
Most funds offer a range of different policies providing hospital cover. These policies may differ on the basis of the range of treatments that are covered, to what extent those treatments are covered, the level of excess or co-payments you may be required to pay if you go to hospital and the price and discounts available to you.
Hospital charges covered
This column indicates the proportion of total charges associated with treatment of private patients covered by each fund's benefits. This includes charges for hospital accommodation, theatre costs, prostheses and specialist fees (not including the Medicare benefit), excesses or co-payments and associated benefits.
The figures shown are average outcomes across all of each fund's hospital policies. Higher cost policies will generally cover a greater proportion of charges than indicated by this average. Cheaper policies, including those with higher excesses or co-payments, may cover less.
The use of an average figure applying across all of each fund's policies will mean that funds with a high proportion of their membership in lower cost/restricted and excluded benefit policies will have a lower average figure.
Information is not provided for some funds in some states, where there were insufficient numbers reported to APRA—generally this occurs in states where the fund does not have a large membership.
The information provided in this table presents the position taking account of all of each fund's policies. It is not indicative of any individual policy offered by the fund but is an average for the total fund membership.
Additional information
The separate Health fund operations by state or territory tables in this report includes information on the number of 'agreement hospitals' under contract to each fund in each state.
For additional information on the medical gap benefits provided through hospital policies, please refer to the separate Medical gap schemes section.
The Ombudsman brochure 'Health Insurance Choice: Selecting a Health Insurance Policy' includes important advice on what factors to consider and what questions to ask when selecting a policy. It also includes information on government incentives relating to hospital policies such as the Medicare Levy Surcharge Exemption and Lifetime Health Cover. The brochure is available on ombudsman.gov.au and privatehealth.gov.au.
The privatehealth.gov.au website provides information about all private health insurance policies available in Australia, including benefits, prices and agreement hospitals for each health fund.
| Fund name (Abbreviated) | % Hospital related charges covered [1] | |||||||
|---|---|---|---|---|---|---|---|---|
| ACT | NSW | VIC | QLD | SA | WA | TAS | NT | |
| Open membership funds | ||||||||
| Australian Unity | 83.6% | 87.3% | 90.9% | 88.6% | 91.0% | 88.8% | 89.1% | 82.6% |
| BUPA | 81.2% | 88.9% | 92.8% | 90.8% | 95.2% | 88.4% | 93.8% | 90.8% |
| CBHS Corporate | 70.9% | 87.1% | 85.0% | 95.2% | 80.5% | 96.6% | n/a | n/a |
| CDH | 25.5% | 96.4% | 93.3% | 78.2% | 95.9% | 71.7% | 99.2% | n/a |
| CUA Health | 80.6% | 88.6% | 90.1% | 92.0% | 88.2% | 89.0% | 88.8% | 81.0% |
| GMHBA | 73.8% | 80.7% | 89.9% | 84.4% | 88.3% | 87.6% | 88.0% | 83.6% |
| GU Health Corporate | 85.6% | 86.2% | 88.9% | 89.4% | 89.9% | 88.6% | 89.5% | 88.1% |
| HBF | 84.7% | 90.3% | 93.5% | 88.7% | 94.0% | 96.1% | 95.9% | 91.7% |
| HCF | 87.7% | 93.2% | 93.4% | 92.4% | 95.1% | 90.4% | 93.4% | 91.5% |
| HCI | 96.7% | 89.1% | 94.2% | 90.8% | 94.2% | 95.2% | 95.7% | 100.0% |
| Health.com.au | 73.7% | 81.0% | 83.9% | 83.8% | 83.8% | 84.5% | 88.3% | 85.1% |
| Health Partners | 82.0% | 89.0% | 91.4% | 91.5% | 95.6% | 89.9% | 94.9% | 90.9% |
| HIF | 79.2% | 86.9% | 91.6% | 90.3% | 93.2% | 92.2% | 90.0% | 86.5% |
| Latrobe | 84.3% | 88.0% | 92.0% | 91.6% | 89.3% | 89.9% | 91.4% | 87.8% |
| MDHF | 84.2% | 94.7% | 94.4% | 91.1% | 89.1% | 88.9% | 97.4% | 98.4% |
| Medibank | 83.1% | 89.4% | 92.4% | 89.9% | 93.6% | 90.4% | 93.6% | 90.0% |
| NIB | 76.1% | 87.4% | 85.6% | 84.2% | 90.6% | 84.9% | 88.8% | 78.0% |
| Onemedifund | 93.7% | 92.7% | 95.0% | 93.7% | 96.4% | 94.5% | 94.7% | n/a |
| Peoplecare | 80.1% | 91.7% | 92.8% | 90.6% | 92.9% | 90.7% | 93.2% | 91.7% |
| Phoenix | 88.5% | 94.1% | 93.9% | 93.1% | 97.8% | 94.0% | 97.6% | 89.6% |
| QCH | 60.7% | 90.8% | 91.2% | 89.5% | 95.1% | 90.8% | 91.5% | 80.9% |
| St Lukes | 81.8% | 93.2% | 93.4% | 91.4% | 95.7% | 86.3% | 95.2% | 48.5% |
| Transport Health | 90.4% | 89.9% | 94.3% | 91.2% | 94.7% | 95.0% | 92.6% | n/a |
| Westfund | 86.8% | 92.1% | 96.3% | 92.1% | 97.0% | 95.5% | 92.2% | 82.7% |
| Restricted membership funds | ||||||||
| ACA | 88.2% | 94.3% | 96.9% | 92.4% | 94.9% | 97.9% | 89.3% | n/a |
| CBHS | 84.8% | 90.2% | 94.3% | 93.0% | 95.8% | 92.8% | 95.6% | 96.0% |
| Defence Health | 84.3% | 91.0% | 93.7% | 92.5% | 94.8% | 93.1% | 94.7% | 93.3% |
| Doctors' Health | 90.8% | 91.7% | 92.3% | 92.0% | 89.5% | 90.9% | 91.7% | 89.6% |
| Emergency Services | 100.0% | 93.1% | 95.0% | 96.5% | 98.1% | 94.4% | 98.1% | 78.7% |
| MO Health | 56.6% | 84.1% | 84.8% | 85.4% | 81.9% | 83.7% | 67.3% | n/a |
| Navy Health | 86.6% | 91.8% | 93.4% | 92.8% | 94.0% | 94.7% | 95.1% | 94.0% |
| Nurses and Midwives | 50.4% | 87.3% | 89.9% | 87.9% | 89.9% | 90.8% | 94.0% | n/a |
| Police Health | 91.2% | 90.9% | 93.6% | 92.6% | 97.7% | 93.7% | 95.7% | 92.7% |
| Reserve Bank | 93.3% | 92.5% | 97.8% | 97.2% | 99.4% | 97.1% | 99.0% | n/a |
| RT Health Fund | 72.2% | 94.3% | 93.0% | 93.3% | 95.6% | 93.8% | 89.5% | 92.9% |
| Teachers Health | 86.7% | 91.6% | 93.0% | 92.7% | 94.3% | 91.6% | 94.2% | 92.8% |
| TUH | 89.8% | 92.7% | 90.6% | 92.3% | 94.6% | 92.9% | 96.6% | 95.9% |
[1] Includes charges for hospital accommodation, theatre costs, prostheses and specialist fees (not including the Medicare benefit) and associated benefits (after any excesses and co-payments are deducted).
Note: 'n/a' signifies no activity in that state. 100 per cent is likely to indicate small numbers (e.g. only 1 episode).
MEDICAL GAP SCHEMES
Health insurer 'medical gap schemes' are designed to eliminate or reduce the out-of-pocket costs incurred by a patient for in-hospital medical services. If a service is 'no gap,' it means no cost was incurred by the patient as the full cost was covered by Medicare and the health fund. A reduced cost is incurred by the patient for what is called a 'known gap' service.
If a health fund has a higher percentage of services covered at no gap than other funds, it indicates the fund has a more effective gap scheme in that state. The figures provided are averages—it is no guarantee that a particular doctor will choose to use the fund's gap scheme.
Fund gap schemes and agreements
Doctors are free to decide whether or not to use a particular fund's gap cover arrangements for each individual patient. Factors that can affect the acceptance of the scheme by doctors include:
- whether the fund has a substantial share of the health insurance market in a particular state or region
- the level of fund benefits paid under the gap arrangements (compared with the doctor's desired fee)
- the design of the fund's gap cover arrangements, including any administrative burden for the doctor.
State-based differences
Information is provided on a state basis because the effectiveness of some funds' gap schemes can differ between states and these differences are not apparent in the national figures.
Most differences are due to the level of doctors' fees, which vary significantly between different states, and between regional areas and capital cities. In some states, funds are able to provide more effective coverage of gaps because doctors charge less than the national average. In addition, where a doctor's fee for an in-hospital service is at or below the Medicare Benefits Schedule fee, there will be no gap to the fund member.
If a health fund's percentage of services with no gap is higher than that of a fund in another state, it does not necessarily mean the fund's scheme is more effective, because state-based differences could be the cause.
Information is not provided for some funds in some states, as the numbers are not reported to APRA for states in which the fund does not have a sufficiently large membership (in which case, these figures are included with figures for the state in which a fund has the largest number of members).
Comparing different gap schemes
If a health fund has a higher percentage of services covered at no gap (in the same state/territory) compared with another fund, it is an indicator of a more effective gap scheme in that state. Over the whole fund, it is more likely that a medical service can be provided at no cost to the consumer, but it is no guarantee that a particular doctor will choose to use the fund's gap scheme.
Percentage of services with no gaps—the proportion of services for which a gap is not payable by the patient after the impact of fund benefits, schemes and agreements.
Percentage of services with no gap or where known gap payment made—this table includes both the percentage of no gap services and what is called 'known gap' services. Known gap schemes are an arrangement where the fund pays an additional benefit on the understanding that the provider advises the patient of costs upfront.
Tables 4A and 4B take into account all of the fund's policies. The information in the tables is not indicative of any individual policy offered by the fund but is an average for the total fund membership.
| Fund Name (Abbreviated) | % of Services with no gap | |||||||
|---|---|---|---|---|---|---|---|---|
| ACT | NSW | VIC | QLD | SA | WA | TAS | NT | |
| Open membership funds | ||||||||
| Australian Unity | 84.2% | 91.3% | 92.0% | 92.3% | 92.6% | 88.5% | 90.7% | 82.1% |
| BUPA | 81.9% | 88.6% | 89.0% | 88.9% | 88.8% | 85.0% | 89.5% | 86.6% |
| CBHS Corporate | 85.7% | 67.8% | 34.6% | 96.0% | 59.3% | 89.7% | n/a | n/a |
| CDH | n/a | 88.1% | 59.3% | 66.0% | 70.8% | 59.1% | 65.2% | n/a |
| CUA Health | 82.3% | 91.0% | 90.9% | 94.2% | 86.9% | 88.7% | 90.5% | 86.7% |
| GMHBA | 50.9% | 74.6% | 80.1% | 81.3% | 80.0% | 70.8% | 78.3% | 61.0% |
| GU Health Corporate | 83.1% | 86.6% | 88.8% | 89.7% | 90.6% | 83.4% | 85.3% | 96.0% |
| HBF | 45.3% | 43.1% | 34.8% | 36.4% | 36.0% | 87.9% | 38.9% | 26.2% |
| HCF | 80.2% | 91.1% | 89.5% | 92.0% | 90.3% | 86.7% | 88.8% | 88.9% |
| HCI | 91.4% | 85.9% | 90.4% | 90.7% | 90.7% | 90.3% | 92.3% | 100.0% |
| Health.com.au | 74.1% | 84.7% | 86.7% | 87.6% | 83.1% | 85.3% | 90.8% | 89.3% |
| Health Partners | 85.0% | 91.2% | 89.5% | 94.0% | 93.1% | 83.7% | 98.1% | 86.5% |
| HIF | 69.5% | 84.8% | 87.7% | 88.3% | 87.0% | 86.3% | 86.8% | 78.8% |
| Latrobe | 45.1% | 78.4% | 77.7% | 81.8% | 84.9% | 67.5% | 74.2% | 34.4% |
| MDHF | 28.6% | 84.1% | 82.6% | 80.1% | 79.7% | 76.7% | 88.3% | 75.7% |
| Medibank | 80.0% | 88.4% | 85.1% | 88.6% | 89.9% | 72.1% | 92.1% | 82.9% |
| NIB | 66.2% | 92.6% | 91.4% | 85.9% | 93.6% | 81.8% | 85.3% | 77.2% |
| Onemedifund | 56.5% | 89.6% | 92.7% | 94.5% | 90.7% | 82.7% | 92.3% | n/a |
| Peoplecare | 78.6% | 92.5% | 90.8% | 91.5% | 90.7% | 87.4% | 93.6% | 85.1% |
| Phoenix | 81.3% | 92.3% | 90.4% | 90.8% | 93.7% | 86.7% | 92.6% | 83.9% |
| QCH | 60.8% | 93.2% | 91.8% | 91.7% | 90.8% | 85.5% | 85.7% | 72.5% |
| St Lukes | 74.2% | 87.2% | 83.1% | 76.9% | 85.9% | 79.7% | 91.2% | 60.0% |
| Transport Health | 70.8% | 88.5% | 92.5% | 91.2% | 94.5% | 90.6% | 73.0% | n/a |
| Westfund | 59.4% | 92.4% | 93.0% | 89.4% | 92.3% | 88.0% | 76.8% | 86.3% |
| Restricted membership funds | ||||||||
| ACA | 89.2% | 91.1% | 93.5% | 94.0% | 93.9% | 92.9% | 95.4% | n/a |
| CBHS | 85.0% | 89.0% | 90.9% | 92.4% | 90.7% | 85.6% | 93.1% | 87.2% |
| Defence Health | 79.5% | 89.3% | 91.1% | 92.4% | 90.3% | 88.0% | 91.4% | 88.7% |
| Doctors' Health | 87.2% | 92.4% | 93.4% | 94.1% | 91.0% | 90.8% | 88.5% | 76.9% |
| Emergency Services | 100.0% | 88.8% | 93.0% | 91.5% | 89.4% | 81.5% | 66.7% | 54.2% |
| MO Health | 75.0% | 84.8% | 85.4% | 91.7% | 93.8% | 75.8% | 14.3% | n/a |
| Navy Health | 82.6% | 90.4% | 91.9% | 91.8% | 93.3% | 88.3% | 92.6% | 86.9% |
| Nurses and Midwives | 76.5% | 85.1% | 84.3% | 90.7% | 86.9% | 86.9% | 80.3% | n/a |
| Police Health | 80.5% | 87.7% | 86.7% | 88.8% | 90.9% | 81.7% | 89.2% | 83.3% |
| Reserve Bank | 79.2% | 91.4% | 93.3% | 95.7% | 97.8% | 90.2% | 92.7% | n/a |
| RT Health Fund | 86.9% | 93.4% | 91.4% | 93.5% | 90.8% | 87.3% | 91.1% | 84.8% |
| Teachers Health | 82.0% | 90.5% | 90.7% | 92.7% | 89.9% | 86.1% | 92.8% | 89.8% |
| TUH | 86.9% | 91.2% | 85.1% | 93.1% | 86.7% | 89.2% | 96.2% | 98.2% |
Note: 'n/a' signifies no activity or very low activity in that state. 100 per cent is likely to indicate small numbers (e.g. only 1 episode).
| Fund Name (Abbreviated) | % of Services with no gap or where known gap payment made | |||||||
|---|---|---|---|---|---|---|---|---|
| ACT | NSW | VIC | QLD | SA | WA | TAS | NT | |
| Open membership funds | ||||||||
| Australian Unity | 93.3% | 96.6% | 97.7% | 96.7% | 98.5% | 95.7% | 97.6% | 91.8% |
| BUPA | 90.0% | 93.4% | 93.8% | 92.5% | 94.7% | 91.8% | 94.3% | 92.8% |
| CBHS Corporate | 85.7% | 78.2% | 65.4% | 96.9% | 92.6% | 92.6% | n/a | n/a |
| CDH | 50.0% | 97.6% | 84.8% | 90.1% | 95.8% | 100.0% | 100.0% | n/a |
| CUA Health | 96.6% | 97.2% | 98.2% | 98.1% | 98.9% | 96.1% | 99.5% | 93.9% |
| GMHBA | 77.3% | 90.9% | 92.8% | 93.7% | 94.9% | 85.2% | 89.5% | 89.5% |
| GU Health Corporate | 92.8% | 94.8% | 97.5% | 96.3% | 98.9% | 94.2% | 92.5% | 96.0% |
| HBF | 98.0% | 98.9% | 99.6% | 99.4% | 99.6% | 99.7% | 99.6% | 99.1% |
| HCF | 95.6% | 98.5% | 99.4% | 99.1% | 99.8% | 98.1% | 99.4% | 98.7% |
| HCI | 98.1% | 94.7% | 97.7% | 96.5% | 97.7% | 99.4% | 99.0% | 100.0% |
| Health.com.au | 92.8% | 95.3% | 97.4% | 96.3% | 97.6% | 96.1% | 98.7% | 96.6% |
| Health Partners | 93.8% | 96.8% | 97.7% | 97.8% | 99.7% | 92.2% | 98.3% | 100.0% |
| HIF | 88.4% | 95.5% | 98.0% | 96.7% | 98.9% | 97.1% | 96.8% | 92.4% |
| Latrobe | 99.7% | 99.4% | 99.9% | 99.7% | 99.9% | 99.1% | 99.5% | 98.4% |
| MDHF | 53.1% | 97.7% | 98.8% | 93.8% | 95.8% | 93.0% | 100.0% | 100.0% |
| Medibank | 92.4% | 96.3% | 93.8% | 94.8% | 99.0% | 87.7% | 98.3% | 94.2% |
| NIB | 66.2% | 92.6% | 91.4% | 85.9% | 93.6% | 81.8% | 85.3% | 77.2% |
| Onemedifund | 100.0% | 96.3% | 99.0% | 98.4% | 99.5% | 94.2% | 99.0% | n/a |
| Peoplecare | 92.7% | 97.8% | 98.6% | 97.5% | 99.1% | 96.6% | 99.3% | 96.8% |
| Phoenix | 95.4% | 98.8% | 98.9% | 97.8% | 99.7% | 97.2% | 100.0% | 94.6% |
| QCH | 81.0% | 97.4% | 97.2% | 97.7% | 99.1% | 94.1% | 95.0% | 93.8% |
| St Lukes | 82.0% | 92.1% | 90.4% | 82.1% | 93.0% | 88.1% | 98.7% | 100.0% |
| Transport Health | 93.1% | 96.2% | 98.6% | 98.0% | 100.0% | 98.4% | 86.5% | n/a |
| Westfund | 68.2% | 96.8% | 98.1% | 96.1% | 98.3% | 96.6% | 84.6% | 98.0% |
| Restricted membership funds | ||||||||
| ACA | 95.4% | 97.1% | 99.1% | 98.2% | 99.7% | 97.8% | 101.3% | n/a |
| CBHS | 95.9% | 96.4% | 98.2% | 97.3% | 98.6% | 95.5% | 98.8% | 95.5% |
| Defence Health | 93.6% | 96.6% | 98.8% | 97.7% | 99.4% | 96.3% | 98.2% | 96.4% |
| Doctors' Health | 97.4% | 98.2% | 99.1% | 98.7% | 98.8% | 97.7% | 97.9% | 97.5% |
| Emergency Services | 100.0% | 96.0% | 98.1% | 96.2% | 100.0% | 100.0% | 100.0% | 79.2% |
| MO Health | 95.0% | 94.9% | 97.0% | 100.0% | 93.8% | 93.7% | 100.0% | n/a |
| Navy Health | 94.5% | 97.0% | 98.6% | 97.6% | 99.3% | 97.2% | 98.1% | 94.0% |
| Nurses and Midwives | 96.1% | 95.9% | 96.5% | 96.0% | 97.0% | 95.4% | 91.5% | n/a |
| Police Health | 96.5% | 95.3% | 97.2% | 96.5% | 99.4% | 94.4% | 98.5% | 94.7% |
| Reserve Bank | 83.3% | 96.9% | 99.3% | 98.3% | 99.1% | 98.5% | 100.0% | n/a |
| RT Health Fund | 96.7% | 98.1% | 98.5% | 98.1% | 99.3% | 96.0% | 99.4% | 100.0% |
| Teachers Health | 95.1% | 97.2% | 98.7% | 97.9% | 99.2% | 95.9% | 98.9% | 98.1% |
| TUH | 92.8% | 97.2% | 97.5% | 97.9% | 100.0% | 96.9% | 99.2% | 99.1% |
Note: 'n/a' signifies no activity or very low activity in that state. 100 per cent is likely to indicate small numbers (e.g. only 1 episode).
GENERAL TREATMENT (EXTRAS)
General treatment or extras policies provide benefits towards a range of out-of-hospital health services. The most commonly included services are dental, optical, physiotherapy and non-Pharmaceutical Benefits Scheme prescription medicines.
Table 5A (on page 26) shows the average proportion of service charges covered by each fund per state for all their policies and services. Table 5B (on page 27) shows the information according to the service being covered. Generally, higher-cost policies cover a higher proportion of charges.
General treatment
General treatment policies, also known as 'ancillary' or 'extras', provide benefits towards a range of health-related services not provided by a doctor, including, but not limited to:
- dental fees and charges
- optometry—cost of glasses and lenses
- physiotherapy, chiropractic services and other therapies including natural and complementary therapies
- prescribed medicines not covered by the Pharmaceutical Benefits Scheme.
Percentage of charges covered, all services, by state
Table 5A indicates what proportion of total charges, associated with general treatment services, is covered by each fund's benefits. This is an average of outcomes across all of each fund's general treatment policies and services. Higher cost policies will generally cover a greater proportion of charges than indicated by this average, while cheaper policies may cover less.
Average costs covered for each service type
Table 5B provides information on the proportion of the total charge for each service type covered by each fund on average, across all of the fund's general treatment policies.
This is intended to provide a broad comparative indicator of fund general treatment benefits to allow comparisons between funds and should not be regarded as an indicator of how much of a bill for any particular service will be covered.
Ambulance
Some funds do not provide ambulance cover through any of their general treatment policies but offer this as a component of hospital cover. These funds show as 'n/a' under the ambulance column. Most ambulance services in Queensland and Tasmania are provided free to residents of those states.
Preferred providers
Many funds establish 'preferred provider' or 'participating provider' arrangements with some suppliers of general treatment services. Those providers offer an agreed charge for fund members, resulting in lower out-of-pocket costs for members after fund benefits are taken into account. It is usually worth checking with your fund to see if a suitable preferred provider is available in your area.
Fund dental and eyecare centres
In some states, some funds operate their own dental and optical centres. These are usually only located in capital cities or major population centres.
Consumers who choose to use a fund's own dental or optical centre will normally get services at a lower out of pocket cost.
Additional information
The Ombudsman brochure 'Health Insurance Choice: Selecting a Health Insurance Policy' includes important advice on what to consider and what questions to ask when selecting a general treatment policy. The brochure is available at ombudsman.gov.au.
The Ombudsman's consumer website privatehealth.gov.au provides information about all private health insurance policies available in Australia, including benefits, prices and which hospitals a health fund has agreements with.
| Fund Name (Abbreviated) | % General treatment (extras) charges covered | |||||||
|---|---|---|---|---|---|---|---|---|
| ACT | NSW | VIC | QLD | SA | WA | TAS | NT | |
| Open membership funds | ||||||||
| Australian Unity | 44.7% | 47.1% | 50.6% | 50.5% | 53.8% | 49.5% | 47.6% | 49.7% |
| BUPA | 45.9% | 50.0% | 49.0% | 53.2% | 55.1% | 58.1% | 51.4% | 58.7% |
| CBHS Corporate | 36.7% | 50.5% | 51.9% | 55.2% | 58.2% | 43.2% | 44.4% | 56.4% |
| CDH | 36.5% | 39.1% | 41.9% | 36.7% | 37.0% | 37.8% | 43.6% | n/a |
| CUA Health | 43.2% | 53.3% | 49.6% | 46.3% | 49.3% | 48.1% | 44.9% | 42.3% |
| GMHBA | 51.9% | 54.7% | 50.9% | 54.7% | 55.3% | 51.7% | 50.2% | 51.8% |
| GU Health Corporate | 72.9% | 74.3% | 75.5% | 73.0% | 74.1% | 76.1% | 74.8% | 76.2% |
| HBF | 47.4% | 50.8% | 51.3% | 51.6% | 55.0% | 58.4% | 57.0% | 56.5% |
| HCF | 48.6% | 51.0% | 56.0% | 57.9% | 61.6% | 59.0% | 50.8% | 51.7% |
| HCI | 44.8% | 55.9% | 55.4% | 50.5% | 52.5% | 51.5% | 48.5% | 54.8% |
| Health.com.au | 2.9% | 51.6% | 53.2% | 52.3% | 54.4% | 54.3% | 54.1% | 52.9% |
| Health Partners | 49.7% | 46.8% | 43.7% | 39.4% | 57.1% | 39.2% | 45.6% | 49.2% |
| HIF | 42.0% | 46.6% | 46.6% | 47.4% | 50.2% | 47.6% | 46.5% | 47.0% |
| Latrobe | 25.1% | 41.1% | 35.5% | 33.8% | 37.3% | 41.7% | 34.0% | 33.1% |
| MDHF | 42.3% | 54.3% | 56.4% | 49.2% | 54.2% | 46.4% | 57.1% | 51.4% |
| Medibank | 47.9% | 51.3% | 53.1% | 55.0% | 59.0% | 57.5% | 54.0% | 59.8% |
| NIB | 53.6% | 53.9% | 58.4% | 55.7% | 59.8% | 58.5% | 55.5% | 58.2% |
| Onemedifund | 47.2% | 52.3% | 54.8% | 53.0% | 57.6% | 55.6% | 55.6% | n/a |
| Peoplecare | 48.2% | 50.2% | 49.0% | 48.5% | 52.1% | 47.8% | 46.7% | 48.6% |
| Phoenix | 48.5% | 53.6% | 54.1% | 53.5% | 57.2% | 52.8% | 51.8% | 56.4% |
| QCH | 44.9% | 48.8% | 48.4% | 52.6% | 53.5% | 47.0% | 50.3% | 44.9% |
| St Lukes | 58.2% | 64.2% | 61.5% | 61.0% | 65.8% | 59.4% | 60.7% | 61.0% |
| Transport Health | 42.1% | 48.8% | 54.5% | 49.1% | 50.1% | 48.0% | 54.2% | 48.2% |
| Westfund | 44.7% | 50.2% | 48.0% | 53.4% | 49.5% | 48.9% | 44.2% | 42.1% |
| Restricted membership funds | ||||||||
| ACA | 57.7% | 60.4% | 61.5% | 61.2% | 66.0% | 63.3% | 57.6% | 62.1% |
| CBHS | 44.9% | 49.1% | 50.8% | 51.6% | 54.1% | 51.0% | 50.1% | 45.3% |
| Defence Health | 45.1% | 48.8% | 51.2% | 51.5% | 55.7% | 51.7% | 49.3% | 53.4% |
| Doctors' Health | 55.2% | 53.8% | 55.4% | 56.5% | 58.4% | 55.6% | 59.5% | 52.2% |
| Emergency Services | 58.8% | 61.7% | 64.9% | 67.1% | 67.3% | 69.7% | 61.5% | 73.9% |
| MO Health | 57.1% | 58.0% | 60.2% | 59.8% | 57.1% | 62.3% | 49.2% | 56.9% |
| Navy Health | 45.3% | 49.4% | 54.0% | 51.4% | 55.4% | 52.5% | 51.6% | 51.7% |
| Nurses and Midwives | 52.3% | 53.4% | 52.8% | 52.7% | 59.4% | 56.3% | 49.9% | 47.8% |
| Police Health | 65.2% | 65.9% | 68.9% | 68.5% | 71.1% | 69.4% | 67.8% | 69.5% |
| Reserve Bank | 71.1% | 72.9% | 73.7% | 73.1% | 81.0% | 75.7% | 77.8% | 77.2% |
| RT Health Fund | 45.7% | 51.3% | 47.9% | 49.3% | 52.2% | 48.1% | 46.5% | 45.8% |
| Teachers Health | 44.9% | 50.2% | 50.7% | 50.3% | 53.7% | 52.0% | 49.6% | 46.9% |
| TUH | 46.8% | 50.0% | 48.5% | 55.5% | 55.8% | 49.6% | 51.2% | 50.0% |
Note: 'n/a' signifies no activity in that state. 100 per cent is likely to indicate small numbers (e.g. only 1 episode).
| Average amount of costs covered by service | |||||||||||||
|---|---|---|---|---|---|---|---|---|---|---|---|---|---|
| Fund Name (Abbreviated) | Dental [1] | Optical [1] | Physiotherapy | Chiropractic | Pharmacy | Podiatry | Natural therapies | Ambulance | Acupuncture | Psychology/Group Therapy | Preventative health | Hearing aids and Audiology | Occupational Therapy |
| Open membership funds | |||||||||||||
| Australian Unity | 46.2% | 64.8% | 62.3% | 47.3% | 36.7% | 47.3% | 46.5% | 99.1% | 39.9% | 34.2% | 72.1% | 15.2% | 44.4% |
| BUPA | 54.3% | 56.7% | 48.9% | 50.3% | 36.0% | 48.8% | 37.7% | 99.9% | 40.9% | 42.2% | 27.6% | 18.4% | 34.9% |
| CBHS Corporate | 48.5% | 54.8% | 55.8% | 60.2% | 41.2% | 52.1% | 52.6% | 0.0% | 54.7% | 46.6% | 22.5% | 42.7% | 33.9% |
| CDH | 39.8% | 51.4% | 49.7% | 43.4% | 41.9% | 35.4% | 27.6% | 100.0% | 43.1% | 21.7% | 58.3% | n/a | 28.2% |
| CUA Health | 50.5% | 60.7% | 39.3% | 42.2% | 13.0% | 56.0% | 40.0% | 100.0% | 46.1% | 35.3% | 56.7% | 33.5% | 39.0% |
| GMHBA | 52.0% | 58.3% | 48.8% | 51.1% | 38.7% | 49.7% | 46.6% | 88.6% | 47.9% | 46.8% | 61.1% | 26.2% | 43.6% |
| GU Health Corporate | 79.2% | 67.2% | 82.8% | 79.2% | 53.5% | 78.4% | 80.6% | 99.9% | 78.8% | 78.2% | 53.6% | 17.0% | 87.6% |
| HBF | 60.8% | 59.1% | 44.1% | 46.2% | 51.1% | 49.4% | 49.9% | 99.9% | n/a | 42.4% | 80.4% | 31.3% | 46.8% |
| HCF | 58.3% | 57.3% | 43.8% | 42.6% | 36.2% | 40.6% | 32.5% | 100.0% | 31.2% | 46.7% | 47.2% | 28.6% | 45.1% |
| HCI | 53.4% | 53.6% | 44.6% | 53.4% | 46.4% | 45.8% | 54.3% | 100.0% | 59.1% | 33.7% | 59.4% | 49.4% | 40.6% |
| Health.com.au | 50.3% | 45.9% | 60.0% | 59.4% | 32.8% | 60.0% | 59.6% | 100.0% | 58.0% | 0.7% | n/a | 10.5% | 56.5% |
| Health Partners | 60.3% | 53.9% | 59.2% | 43.9% | 48.3% | 32.4% | 25.7% | 99.6% | 29.8% | 32.6% | 68.1% | 31.8% | 38.1% |
| HIF | 49.0% | 59.9% | 36.8% | 36.9% | 41.8% | 36.6% | 23.2% | 99.1% | 22.0% | 34.2% | 36.3% | 30.3% | 34.3% |
| Latrobe | 32.6% | 54.1% | 33.2% | 35.6% | 23.5% | 36.5% | 25.4% | 76.5% | 41.8% | 33.1% | 28.8% | 13.6% | 40.3% |
| MDHF | 61.8% | 65.4% | 43.0% | 46.7% | 24.4% | 46.1% | 39.2% | 82.2% | 33.6% | 27.3% | 49.1% | 22.3% | 34.3% |
| Medibank | 52.5% | 68.1% | 47.8% | 53.0% | 25.7% | 51.7% | 51.8% | 100.0% | 43.4% | 30.8% | 56.3% | 26.5% | 36.7% |
| NIB | 56.0% | 53.4% | 58.4% | 57.4% | 41.4% | 56.4% | 54.2% | 100.0% | 55.4% | 55.2% | 47.1% | 19.2% | 56.6% |
| Onemedifund | 58.9% | 51.8% | 53.2% | 46.7% | 39.6% | 45.2% | 38.7% | 99.1% | 38.3% | 33.8% | 72.1% | 52.4% | 42.5% |
| Peoplecare | 49.1% | 61.6% | 40.3% | 43.8% | 35.8% | 40.2% | 38.7% | 99.6% | 42.2% | 38.5% | 65.6% | 34.4% | 37.9% |
| Phoenix | 57.2% | 61.3% | 50.2% | 47.7% | 40.3% | 51.4% | 35.4% | 99.2% | 44.9% | 41.2% | 49.7% | 41.0% | 43.7% |
| QCH | 52.3% | 58.7% | 46.6% | 60.2% | 38.6% | 60.7% | 40.3% | n/a | 43.6% | 44.3% | 41.4% | 35.7% | 38.5% |
| St Lukes | 64.6% | 75.9% | 52.4% | 52.9% | 41.2% | 48.5% | 42.3% | 85.9% | 46.6% | 48.5% | 53.2% | 47.0% | 49.1% |
| Transport Health | 55.5% | 58.3% | 45.6% | 54.3% | 33.1% | 52.3% | 41.7% | 100.0% | 35.0% | 29.9% | 54.5% | 33.3% | 30.2% |
| Westfund | 54.7% | 53.6% | 50.0% | 55.7% | 39.1% | 46.9% | 40.2% | 99.7% | 37.8% | 39.3% | 68.1% | 38.8% | 48.9% |
| Restricted membership funds | |||||||||||||
| ACA | 64.6% | 71.6% | 43.9% | 49.4% | 46.2% | 72.7% | 38.5% | 99.6% | 38.1% | 49.9% | n/a | 41.8% | 58.6% |
| CBHS | 50.0% | 52.8% | 52.1% | 60.6% | 41.5% | 44.3% | 44.5% | 96.6% | 45.7% | 40.9% | 43.2% | 36.0% | 35.3% |
| Defence Health | 49.6% | 52.3% | 53.2% | 55.3% | 45.7% | 51.8% | 39.2% | 100.0% | 35.6% | 49.1% | 93.4% | 29.7% | 49.6% |
| Doctors' Health | 58.6% | 61.0% | 46.5% | n/a | 46.5% | 50.7% | n/a | n/a | n/a | 51.0% | 30.8% | 21.4% | 38.7% |
| Emergency Services | 67.5% | 55.9% | 73.3% | 75.7% | 46.9% | 66.5% | 35.2% | 100.0% | 75.5% | 77.8% | n/a | 25.2% | 65.2% |
| MO Health | n/a | 66.8% | n/a | 56.8% | 62.2% | 100.0% | 29.8% | 62.0% | 100.0% | n/a | 61.5% | 61.9% | 61.2% |
| Navy Health | 48.0% | 58.8% | 54.6% | 61.5% | 45.7% | 53.7% | 46.7% | 99.4% | n/a | 42.2% | 100.0% | 29.2% | 36.5% |
| Nurses and Midwives | 54.8% | 60.9% | 45.9% | 61.7% | 43.2% | 58.0% | 45.7% | 100.0% | 42.8% | 41.5% | 52.2% | 21.3% | 59.2% |
| Police Health | 70.1% | 67.3% | 75.7% | 77.1% | 44.6% | 68.6% | 39.5% | 98.9% | 75.6% | 75.7% | 100.0% | 36.4% | 71.0% |
| Reserve Bank | 72.6% | 71.7% | 71.9% | 73.6% | 62.3% | 79.8% | 77.7% | 98.9% | 77.1% | 76.3% | 40.0% | 77.1% | 70.8% |
| RT Health Fund | 48.7% | 62.7% | 51.7% | 51.6% | 39.0% | 47.3% | 40.5% | 100.0% | 52.5% | 21.5% | 50.0% | 29.2% | 31.4% |
| Teachers Health | 53.0% | 53.9% | 45.2% | 57.6% | 39.9% | 56.4% | 46.1% | 100.0% | 42.2% | 41.3% | 40.0% | 35.5% | 59.8% |
| TUH | 60.1% | 54.1% | 49.3% | 55.0% | 36.5% | 60.0% | 51.1% | 90.7% | 44.7% | 44.3% | 49.8% | 44.3% | 37.6% |
[1] For some funds, the data does not take account of discounts at some providers or fund dental/optical centres.
Note: All percentages based on health fund reporting to APRA. 'n/a' signifies no activity and 100 per cent is likely to indicate small numbers (e.g. only 1 episode).
FINANCES AND COSTS
All health funds are required to meet financial management standards to ensure their members' contributions are protected. Generally, funds aim to set premium levels so their income from contributions covers the expected cost of benefits plus the fund's administration costs.
The percentage of contribution income which goes towards administration and management expenses is a key measure of fund efficiency.
The regulation of health fund finances
The Private Health Insurance Act 2007 (the Act) specifies solvency and capital adequacy standards for funds to meet and outlines financial management and reporting requirements for all funds.
The Private Health Insurance (Prudential Regulation) Act 2015 (the Prudential Regulation Act) ensures that private health insurers must comply with prudential standards made by APRA and with directions given by APRA. APRA has monitoring and investigative powers in relation to private health insurers in order to monitor the financial performance of the funds and ensure that they meet prudential requirements.
Premium increases
Under the Act, health funds require the approval of the Minister for Health before they can raise their premiums.
The Minister assesses premium applications to ensure proposed increases are kept to the minimum necessary. This takes into consideration fund solvency requirements, forecast benefit payments and prudential requirements, while also ensuring the affordability and value of private health insurance as a product.
Finances and Costs
The following Finances and Costs table (table 6) is drawn from data collected by APRA for the purposes of an annual publication providing financial and operational statistics for the funds for each financial year.2
Benefits as a percentage of contributions
This column in Table 6 shows the percentage of total contributions, received by the fund, returned to contributors in benefits. Funds will generally aim to set premium levels so that contribution income covers the expected costs of benefits plus the fund's administration costs.
A very high percentage of contributions returned as benefits may not necessarily be a positive factor for consumers, particularly if it means that the fund is making a loss on its health insurance business. This indicator should therefore be considered in conjunction with other factors, such as the Surplus (-loss) and Management Expenses ratings.
Management expenses
Management expenses are the costs of administering the fund. They include items such as rent, staff salaries, and marketing costs.
As a percentage of contribution income
This figure is regarded as a key measure of fund efficiency. In this table, management expenses are shown as a proportion of total fund contributions.
Per average policy
A comparison of the relative amount each fund spends on administration costs is also demonstrated through provision of information on the level of management expenses per membership by each fund.
On average, restricted membership funds have lower management expenses as a proportion of benefits paid then open membership funds. This is partially due to lower expenditure on marketing. However, unusually low management expenses by some restricted membership funds can also be the result of those funds receiving free or subsidised administrative services from the organisations with which they are associated.
Surplus (-loss) from health insurance
The surplus or loss (indicated as a negative figure) made by the fund in 2017–18 from their health insurance business is expressed as a percentage of the fund's contribution income. This does not take account of additional income that the fund may derive from investment or other non-health insurance activities.
All health funds maintain a sufficient level of reserves to cover losses from year to year. However funds with high or continuing losses might be expected to have to increase premiums by a higher relative amount than other funds.
Overall profit (-loss) as a percentage of total revenue
The overall profit or loss (indicated as a negative figure) takes account of additional income made by the fund, mainly through investment. This is shown as a percentage of all revenue received by the fund to allow a comparison of performance between funds of differing sizes. Overall profit takes into account tax that is paid for a small amount of funds.
Not-for-profit fund
If a health fund is listed as 'not-for-profit' this means it is a mutual organisation, with the premiums paid into the fund used to operate the business and cover benefits for members.
'For-profit' funds aim to return a profit to their owners (which may be another health fund or corporation) or shareholders.
| Fund name (Abbreviated) | Benefits as % contributions | Management expenses | Surplus (-Loss) from health insurance | Overall profit (- Loss) as % total revenue | Not-for-profit fund | |
|---|---|---|---|---|---|---|
| as % of contribution income | Per average policy (see MREAust Tab) | |||||
| Open membership funds | ||||||
| Australian Unity | 81.5% | 11.1% | $387 | 7.5% | 6.2% | No |
| BUPA | 85.0% | 7.8% | $288 | 7.2% | 6.1% | No |
| CBHS Corporate | n/a | n/a | n/a | n/a | n/a | No |
| CDH | 83.4% | 13.2% | $568 | 3.4% | 5.1% | Yes |
| CUA Health | 83.5% | 9.8% | $362 | 6.7% | 6.1% | No |
| GMHBA | 87.0% | 11.5% | $398 | 1.4% | 3.3% | Yes |
| GU Health Corporate | 78.1% | 12.7% | $771 | 9.2% | 8.2% | No |
| HBF | 90.2% | 9.7% | $311 | 0.1% | 3.5% | Yes |
| HCF | 89.0% | 9.5% | $355 | 1.5% | 4.5% | Yes |
| HCI | 91.2% | 11.2% | $425 | -2.4% | 0.1% | Yes |
| Health.com.au | 86.7% | 6.1% | $194 | 7.2% | 5.6% | No |
| Health Partners | 87.6% | 9.6% | $359 | 2.7% | 9.0% | Yes |
| HIF | 91.3% | 11.7% | $351 | -3.0% | 1.1% | Yes |
| Latrobe | 88.5% | 9.0% | $339 | 2.5% | 4.8% | Yes |
| MDHF | 87.3% | 8.1% | $258 | 4.6% | 5.3% | Yes |
| Medibank | 83.4% | 8.4% | $291 | 8.2% | 7.3% | No |
| NIB | 82.7% | 10.5% | $333 | 6.8% | 6.4% | No |
| Onemedifund | 78.2% | 8.4% | $448 | 13.4% | 10.3% | No |
| Peoplecare | 91.8% | 9.6% | $387 | -1.4% | 1.5% | Yes |
| Phoenix | 88.5% | 8.7% | $396 | 2.8% | 5.2% | Yes |
| QCH | 88.9% | 10.1% | $462 | 1.0% | 2.6% | No |
| St Lukes | 89.7% | 11.4% | $469 | -1.1% | 2.5% | Yes |
| Transport Health | 87.2% | 13.8% | $455 | -1.0% | 1.2% | No |
| Westfund | 80.3% | 15.4% | $605 | 4.3% | 6.3% | Yes |
| Restricted membership funds | ||||||
| ACA | 82.2% | 11.5% | $605 | 6.3% | 8.9% | Yes |
| CBHS | 91.6% | 7.8% | $331 | 0.6% | 4.0% | Yes |
| Defence Health | 94.1% | 6.5% | $253 | -0.6% | 3.2% | Yes |
| Doctors' Health | 82.9% | 10.4% | $547 | 6.7% | 5.7% | No |
| Emergency Services | n/a | n/a | n/a | n/a | n/a | Yes |
| MO Health | n/a | n/a | n/a | n/a | n/a | No |
| Navy Health | 91.0% | 9.7% | $383 | -0.7% | 5.7% | Yes |
| Nurses and Midwives | 104.2% | 33.7% | $1,171 | -37.9% | -34.3% | Yes |
| Police Health | 91.1% | 6.8% | $381 | 2.1% | -3.3% | Yes |
| Reserve Bank | 85.4% | 11.9% | $763 | 2.6% | 4.7% | Yes |
| RT Health Fund | 83.8% | 13.7% | $621 | 2.5% | -12.4% | Yes |
| Teachers Health | 88.3% | 7.0% | $292 | 1.5% | 3.3% | Yes |
| TUH | 84.9% | 9.4% | $455 | 5.8% | 7.3% | Yes |
Note: 'n/a' indicates no data as insurer commenced operations during 2016–17 or 2017–18.
HEALTH FUND OPERATIONS BY STATE OR TERRITORY
Some funds have little presence in most states but may have a large market share in one state or territory. Every fund will still have agreements with hospitals throughout Australia even if they don't have a local branch network or a significant proportion of policy holders in each state. Australian health insurance policies are usually priced according to the policy holder's state of residence, but the benefits extend nation-wide.
Some funds use different brand names or offer different policies in different states and territories. The following separate tables for each state/territory are therefore provided to give an indication of the extent and importance of each fund's business in each area.
Most fund websites allow members to view fund information, join or change their policy and submit claims. Links to all health fund websites are available at Table 1 — Health fund listing and contact details.
Percentage market share
This column (in Tables 7A–7H) indicates how much of the total health insurance business within each state or territory each fund accounts for. It is an indicator of the size and significance of each fund within each state.
Funds with a significant market share in the relevant state or territory can normally be expected to have more extensive networks of branch offices, agencies, agreement hospitals and preferred ancillary providers in those states/territories. They are also more likely to obtain the participation of doctors in their gap cover arrangements. However, funds participating in schemes such as the Australian Health Services Alliance (AHSA) will generally have access to a wide range of agreement hospitals in all states.
Percentage of fund's membership in state
This column (in Tables 7A–7H) indicates how much of each fund's health insurance membership is within each state. It is an indicator of how significant that state is to each fund's health insurance business.
In general, funds can be expected to design their policies (benefits, conditions, contracts, etc.) to suit the arrangements applying in the states in which they do a significant proportion of business. However, some nationally-based funds tailor their policies and prices to take account of different state arrangements.
Health fund costs differ from state to state, which accounts for the variation in premiums across states.
Agreement hospitals3
All health funds establish agreements with some or all private hospitals and day hospitals for the treatment of their members. These agreements generally provide for the fund to meet all of the private hospital's charges for treatment of the fund's members. The member is not required to pay any amount to the hospital, other than any agreed excess or co-payment and any incidental charges that may apply for certain extra services (e.g. television rental or internet).4
Where a fund has a comparatively low number of agreements with private hospitals or private day hospitals, this is an indicator that consumer choices about the location of their treatment may be more limited. Treatment at a non-agreement hospital will mean a significantly higher out of pocket cost for the patient.
While funds do not have agreements with public hospitals, all funds will fully cover hospital costs for treatment as a private patient in a public hospital unless the particular treatment is excluded under the individual's policy, or there is an extra charge for a private room or similar extra costs.
Fund outlets—retail offices and agencies
Retail offices are full-service offices operated by health funds with staff employed by the fund.
Agencies are generally limited service outlets operated by the fund or under arrangements with pharmacies, credit unions, etc.
Tables 7A–7H, indicate whether the fund operates retail offices and/or agencies in the state or territory.
| Fund name (Abbreviated) | % Fund market share this state | % Fund's membership in this state | Agreement hospitals [1] | Fund outlets | ||
|---|---|---|---|---|---|---|
| Private hospitals | Private day hospitals | Retail offices | Agencies | |||
| Open membership funds | ||||||
| Australian Unity | 1.6% | 18.1% | 93 | 88 | ||
| BUPA | 25.2% | 31.6% | 89 | 76 | Yes | |
| CBHS Corporate | 0.0% | 53.6% | 75 | 65 | ||
| CDH | 0.1% | 88.6% | 68 | 29 | Yes | |
| CUA Health | 0.4% | 25.6% | 96 | 90 | Yes | |
| GMHBA | 1.2% | 16.5% | 97 | 90 | ||
| GU Health Corporate | 0.7% | 51.3% | 97 | 94 | ||
| HBF | 0.9% | 3.8% | 93 | 86 | ||
| HCF | 19.6% | 60.5% | 80 | 87 | Yes | |
| HCI | 0.0% | 12.3% | 96 | 99 | ||
| Health.com.au | 0.6% | 35.5% | 81 | 73 | ||
| Health Partners | 0.0% | 1.8% | 97 | 90 | ||
| HIF | 0.3% | 12.2% | 95 | 92 | ||
| Latrobe | 0.2% | 7.6% | 76 | 53 | ||
| MDHF | 0.1% | 11.0% | 77 | 51 | Yes | |
| Medibank | 23.0% | 28.3% | 84 | 81 | Yes | Yes |
| NIB | 13.8% | 53.3% | 97 | 94 | Yes | |
| Onemedifund | 0.1% | 41.2% | 97 | 90 | Yes | |
| Peoplecare | 0.7% | 45.6% | 97 | 90 | Yes | |
| Phoenix | 0.2% | 45.4% | 96 | 89 | Yes | |
| QCH | 0.0% | 1.6% | 93 | 88 | ||
| St Lukes | 0.1% | 3.7% | 75 | 48 | ||
| Transport Health | 0.0% | 14.7% | 97 | 90 | ||
| Westfund | 1.3% | 60.7% | 96 | 91 | Yes | |
| Restricted membership funds | ||||||
| ACA | 0.1% | 57.8% | 96 | 90 | Yes | |
| CBHS | 2.1% | 45.5% | 76 | 65 | ||
| Defence Health | 1.2% | 18.2% | 97 | 90 | Yes | |
| Doctors' Health | 0.4% | 39.9% | 97 | 90 | ||
| Emergency Services | 0.0% | 23.7% | 94 | 91 | ||
| MO Health | 0.09% | 35.8% | 93 | 89 | ||
| Navy Health | 0.3% | 29.7% | 94 | 89 | ||
| Nurses and Midwives | 0.1% | 49.1% | 95 | 89 | ||
| Police | 0.0% | 2.3% | 94 | 91 | ||
| Reserve Bank | 0.1% | 61.3% | 97 | 90 | Yes | |
| RT Health Fund | 0.6% | 49.5% | 97 | 90 | Yes | |
| Teachers Health | 4.9% | 68.6% | 96 | 91 | Yes | |
| TUH | 0.1% | 4.4% | 96 | 92 | ||
[1] Agreement hospitals data is sourced from Privatehealth.gov.au as of 10 January 2019.
| Fund name (Abbreviated) | % Fund market share this state | % Fund's membership in this state | Agreement hospitals [1] | Fund outlets | ||
|---|---|---|---|---|---|---|
| Private hospitals | Private day hospitals | Retail offices | Agencies | |||
| Open membership funds | ||||||
| Australian Unity | 7.4% | 60.9% | 76 | 72 | Yes | |
| BUPA | 23.7% | 21.3% | 74 | 59 | Yes | |
| CBHS Corporate | 0.0% | 16.0% | 70 | 46 | ||
| CDH | 0.0% | 4.6% | 69 | 42 | ||
| CUA Health | 0.4% | 17.0% | 76 | 72 | Yes | Yes |
| GMHBA | 6.3% | 63.3% | 78 | 71 | Yes | Yes |
| GU Health Corporate | 0.4% | 22.3% | 76 | 72 | ||
| HBF | 1.2% | 3.7% | 76 | 70 | ||
| HCF | 6.7% | 14.8% | 67 | 48 | Yes | |
| HCI | 0.1% | 24.3% | 76 | 76 | ||
| Health.com.au | 0.8% | 33.7% | 68 | 59 | ||
| Health Partners | 0.1% | 4.8% | 78 | 71 | ||
| HIF | 0.6% | 15.6% | 74 | 73 | ||
| Latrobe | 2.4% | 88.2% | 74 | 61 | Yes | Yes |
| MDHF | 0.9% | 84.4% | 73 | 60 | Yes | Yes |
| Medibank | 32.8% | 28.9% | 68 | 52 | Yes | |
| NIB | 7.7% | 21.3% | 75 | 70 | Yes | |
| Onemedifund | 0.1% | 24.9% | 78 | 71 | ||
| Peoplecare | 0.7% | 32.8% | 78 | 71 | Yes | |
| Phoenix | 0.1% | 23.5% | 74 | 70 | ||
| QCH | 0.0% | 0.9% | 77 | 71 | ||
| St Lukes | 0.1% | 5.5% | 72 | 60 | ||
| Transport Health | 0.3% | 68.9% | 78 | 71 | ||
| Westfund | 0.0% | 1.5% | 76 | 72 | ||
| Restricted membership funds | ||||||
| ACA | 0.0% | 12.9% | 76 | 72 | ||
| CBHS | 1.5% | 24.4% | 70 | 46 | ||
| Defence Health | 2.6% | 29.9% | 78 | 71 | Yes | Yes |
| Doctors' Health | 0.4% | 29.3% | 78 | 71 | ||
| Emergency Services | 0.0% | 25.0% | 77 | 72 | ||
| MO Health | 0.13% | 36.6% | 75 | 71 | ||
| Navy Health | 0.4% | 27.5% | 75 | 71 | Yes | |
| Nurses and Midwives | 0.1% | 25.3% | 76 | 73 | ||
| Police | 0.1% | 3.5% | 77 | 72 | ||
| Reserve Bank | 0.0% | 23.0% | 78 | 71 | ||
| RT Health Fund | 0.2% | 12.3% | 78 | 71 | ||
| Teachers Health | 1.5% | 15.1% | 77 | 72 | Yes | |
| TUH | 0.1% | 3.5% | 77 | 71 | ||
[1] Agreement hospitals data is sourced from Privatehealth.gov.au as of 10 January 2019.
| Fund name (Abbreviated) | % Fund market share this state | % Fund's membership in this state | Agreement hospitals [1] | Fund outlets | ||
|---|---|---|---|---|---|---|
| Private hospitals | Private day hospitals | Retail offices | Agencies | |||
| Open membership funds | ||||||
| Australian Unity | 2.0% | 12.7% | 52 | 46 | ||
| BUPA | 32.0% | 21.5% | 53 | 42 | Yes | |
| CBHS Corporate | 0.0% | 14.3% | 46 | 33 | ||
| CDH | 0.0% | 4.9% | 39 | 23 | ||
| CUA Health | 1.7% | 52.5% | 52 | 46 | Yes | Yes |
| GMHBA | 1.5% | 11.5% | 52 | 49 | ||
| GU Health Corporate | 0.3% | 10.3% | 54 | 48 | ||
| HBF | 0.8% | 1.8% | 50 | 44 | ||
| HCF | 7.0% | 11.7% | 47 | 38 | Yes | |
| HCI | 0.1% | 10.9% | 57 | 51 | ||
| Health.com.au | 0.6% | 18.9% | 44 | 37 | ||
| Health Partners | 0.1% | 2.1% | 52 | 49 | ||
| HIF | 0.5% | 9.6% | 52 | 44 | ||
| Latrobe | 0.1% | 2.3% | 53 | 32 | ||
| MDHF | 0.0% | 1.8% | 47 | 31 | ||
| Medibank | 32.2% | 21.1% | 52 | 41 | Yes | Yes |
| NIB | 6.4% | 13.2% | 56 | 47 | Yes | |
| Onemedifund | 0.1% | 12.6% | 52 | 49 | ||
| Peoplecare | 0.4% | 12.1% | 52 | 49 | ||
| Phoenix | 0.1% | 14.5% | 52 | 46 | ||
| QCH | 2.1% | 95.4% | 50 | 46 | Yes | Yes |
| St Lukes | 0.1% | 2.9% | 48 | 31 | ||
| Transport Health | 0.1% | 11.9% | 52 | 49 | ||
| Westfund | 1.4% | 35.0% | 53 | 48 | Yes | |
| Restricted membership funds | ||||||
| ACA | 0.1% | 19.4% | 53 | 48 | ||
| CBHS | 1.3% | 15.4% | 46 | 33 | ||
| Defence Health | 3.5% | 29.2% | 52 | 49 | Yes | |
| Doctors' Health | 0.4% | 21.3% | 52 | 49 | ||
| Emergency Services | 0.0% | 25.0% | 50 | 44 | ||
| MO Health | 0.08% | 17.1% | 53 | 45 | ||
| Navy Health | 0.3% | 18.8% | 52 | 43 | ||
| Nurses and Midwives | 0.0% | 10.3% | 52 | 48 | ||
| Police | 0.7% | 34.6% | 50 | 44 | ||
| Reserve Bank | 0.0% | 6.4% | 52 | 49 | ||
| RT Health Fund | 0.7% | 33.6% | 52 | 49 | Yes | |
| Teachers Health | 0.4% | 3.4% | 53 | 47 | ||
| TUH | 3.0% | 90.9% | 53 | 48 | Yes | |
[1] Agreement hospitals data is sourced from Privatehealth.gov.au as of 10 January 2019.
| Fund name (Abbreviated) | % Fund market share this state | % Fund's membership in this state | Agreement hospitals [1] | Fund outlets | ||
|---|---|---|---|---|---|---|
| Private hospitals | Private day hospitals | Retail offices | Agencies | |||
| Open membership funds | ||||||
| Australian Unity | 1.5% | 4.1% | 25 | 24 | ||
| BUPA | 48.7% | 14.3% | 25 | 26 | Yes | |
| CBHS Corporate | 0.0% | 3.3% | 26 | 20 | ||
| CDH | 0.0% | 0.9% | 21 | 7 | ||
| CUA Health | 0.1% | 1.1% | 25 | 26 | ||
| GMHBA | 0.5% | 1.5% | 24 | 29 | ||
| GU Health Corporate | 0.1% | 1.7% | 25 | 27 | ||
| HBF | 0.6% | 0.6% | 25 | 25 | ||
| HCF | 6.9% | 5.0% | 23 | 19 | Yes | |
| HCI | 0.0% | 2.6% | 26 | 29 | ||
| Health.com.au | 0.2% | 2.8% | 26 | 23 | ||
| Health Partners | 7.4% | 90.0% | 24 | 29 | Yes | Yes |
| HIF | 0.3% | 2.6% | 25 | 28 | ||
| Latrobe | 0.0% | 0.6% | 22 | 18 | ||
| MDHF | 0.1% | 2.1% | 22 | 14 | ||
| Medibank | 22.0% | 6.3% | 27 | 19 | Yes | Yes |
| NIB | 3.5% | 3.2% | 24 | 27 | ||
| Onemedifund | 0.1% | 5.0% | 24 | 29 | ||
| Peoplecare | 0.3% | 4.8% | 24 | 29 | ||
| Phoenix | 0.2% | 12.0% | 25 | 24 | ||
| QCH | 0.0% | 0.2% | 25 | 24 | ||
| St Lukes | 0.1% | 1.6% | 22 | 14 | ||
| Transport Health | 0.0% | 1.8% | 24 | 29 | ||
| Westfund | 0.1% | 0.9% | 25 | 26 | ||
| Restricted membership funds | ||||||
| ACA | 0.0% | 3.4% | 25 | 26 | ||
| CBHS | 0.9% | 4.6% | 26 | 20 | ||
| Defence Health | 2.3% | 8.4% | 24 | 29 | Yes | |
| Doctors' Health | 0.1% | 3.3% | 24 | 29 | ||
| Emergency Services | 0.0% | 13.5% | 25 | 25 | ||
| MO Health | 0.0% | 2.2% | 25 | 25 | ||
| Navy Health | 0.2% | 5.6% | 25 | 25 | ||
| Nurses and Midwives | 0.0% | 7.3% | 24 | 24 | ||
| Police | 1.5% | 35.2% | 25 | 25 | Yes | |
| Reserve Bank | 0.0% | 3.5% | 24 | 29 | ||
| RT Health Fund | 0.1% | 1.7% | 24 | 29 | ||
| Teachers Health | 1.9% | 6.3% | 25 | 25 | ||
| TUH | 0.0% | 0.2% | 25 | 25 | ||
[1] Agreement hospitals data is sourced from Privatehealth.gov.au as of 10 January 2019.
| Fund name (Abbreviated) | % Fund market share this state | % Fund's membership in this state | Agreement hospitals [1] | Fund outlets | ||
|---|---|---|---|---|---|---|
| Private hospitals | Private day hospitals | Retail offices | Agencies | |||
| Open membership funds | ||||||
| Australian Unity | 0.5% | 2.4% | 19 | 21 | ||
| BUPA | 11.5% | 5.8% | 20 | 18 | Yes | |
| CBHS Corporate | 0.0% | 8.4% | 16 | 11 | ||
| CDH | 0.0% | 0.3% | 16 | 8 | ||
| CUA Health | 0.1% | 2.2% | 21 | 23 | Yes | |
| GMHBA | 0.9% | 5.0% | 22 | 23 | ||
| GU Health Corporate | 0.4% | 12.2% | 21 | 25 | ||
| HBF | 53.1% | 89.4% | 24 | 23 | Yes | Yes |
| HCF | 3.3% | 4.1% | 18 | 13 | Yes | |
| HCI | 0.0% | 1.3% | 21 | 23 | ||
| Health.com.au | 0.2% | 5.4% | 18 | 17 | ||
| Health Partners | 0.0% | 0.5% | 22 | 23 | ||
| HIF | 3.7% | 58.4% | 21 | 23 | Yes | Yes |
| Latrobe | 0.0% | 0.4% | 18 | 13 | ||
| MDHF | 0.0% | 0.3% | 18 | 13 | ||
| Medibank | 20.2% | 9.9% | 21 | 20 | Yes | Yes |
| NIB | 2.9% | 4.5% | 23 | 23 | ||
| Onemedifund | 0.1% | 11.2% | 22 | 23 | ||
| Peoplecare | 0.1% | 2.6% | 22 | 23 | ||
| Phoenix | 0.0% | 2.8% | 21 | 22 | ||
| QCH | 0.0% | 0.5% | 19 | 23 | ||
| St Lukes | 0.0% | 0.5% | 17 | 13 | ||
| Transport Health | 0.0% | 1.5% | 22 | 23 | ||
| Westfund | 0.0% | 0.7% | 21 | 23 | ||
| Restricted membership funds | ||||||
| ACA | 0.0% | 4.3% | 21 | 23 | ||
| CBHS | 0.8% | 7.1% | 16 | 11 | ||
| Defence Health | 0.7% | 4.4% | 22 | 23 | Yes | |
| Doctors' Health | 0.1% | 2.4% | 22 | 23 | ||
| Emergency Services | 0.0% | 5.2% | 20 | 23 | ||
| MO Health | 0.04% | 5.8% | 19 | 23 | ||
| Navy Health | 0.2% | 7.2% | 20 | 23 | ||
| Nurses and Midwives | 0.0% | 3.3% | 21 | 23 | ||
| Police | 0.3% | 13.5% | 20 | 23 | ||
| Reserve Bank | 0.0% | 3.2% | 22 | 23 | ||
| RT Health Fund | 0.0% | 1.5% | 22 | 23 | ||
| Teachers Health | 0.5% | 3.1% | 21 | 23 | ||
| TUH | 0.0% | 0.2% | 21 | 23 | ||
[1] Agreement hospitals data is sourced from Privatehealth.gov.au as of 10 January 2019.
| Fund name (Abbreviated) | % Fund market share this state | % Fund's membership in this state | Agreement hospitals [1] | Fund outlets | ||
|---|---|---|---|---|---|---|
| Private hospitals | Private day hospitals | Retail offices | Agencies | |||
| Open membership funds | ||||||
| Australian Unity | 1.0% | 0.7% | 8 | 3 | ||
| BUPA | 34.3% | 2.7% | 8 | 5 | Yes | |
| CBHS Corporate | 0.0% | 1.7% | 8 | 2 | ||
| CDH | 0.0% | 0.4% | 8 | 2 | ||
| CUA Health | 0.1% | 0.4% | 8 | 3 | ||
| GMHBA | 1.1% | 1.0% | 5 | 7 | ||
| GU Health Corporate | 0.1% | 0.4% | 8 | 5 | ||
| HBF | 0.8% | 0.2% | 9 | 3 | ||
| HCF | 3.6% | 0.7% | 8 | 4 | ||
| HCI | 2.3% | 47.5% | 8 | 5 | Yes | |
| Health.com.au | 0.2% | 0.7% | 8 | 3 | ||
| Health Partners | 0.1% | 0.2% | 5 | 4 | ||
| HIF | 0.2% | 0.6% | 8 | 5 | ||
| Latrobe | 0.2% | 0.5% | 6 | 8 | ||
| MDHF | 0.0% | 0.2% | 8 | 6 | ||
| Medibank | 28.0% | 2.1% | 5 | 4 | Yes | |
| NIB | 2.6% | 0.6% | 5 | 6 | ||
| Onemedifund | 0.2% | 4.9% | 5 | 4 | ||
| Peoplecare | 0.2% | 0.7% | 5 | 4 | ||
| Phoenix | 0.0% | 0.6% | 6 | 3 | ||
| QCH | 0.0% | 0.2% | 8 | 3 | ||
| St Lukes | 20.0% | 85.6% | 8 | 6 | Yes | Yes |
| Transport Health | 0.0% | 0.5% | 5 | 4 | ||
| Westfund | 0.1% | 0.3% | 8 | 3 | ||
| Restricted membership funds | ||||||
| ACA | 0.0% | 1.3% | 8 | 3 | ||
| CBHS | 1.1% | 1.5% | 8 | 2 | ||
| Defence Health | 1.2% | 1.2% | 5 | 4 | Yes | |
| Doctors' Health | 0.1% | 0.9% | 5 | 4 | ||
| Emergency Services | 0.0% | 1.9% | 8 | 4 | ||
| MO Health | 0.02% | 0.4% | 8 | 3 | ||
| Navy Health | 0.2% | 1.3% | 8 | 3 | ||
| Nurses and Midwives | 0.1% | 2.3% | 5 | 3 | ||
| Police | 0.5% | 2.9% | 8 | 4 | ||
| Reserve Bank | 0.0% | 1.1% | 5 | 4 | ||
| RT Health Fund | 0.1% | 0.4% | 5 | 4 | ||
| Teachers Health | 1.2% | 1.1% | 8 | 3 | ||
| TUH | 0.1% | 0.3% | 8 | 3 | ||
[1] Agreement hospitals data is sourced from Privatehealth.gov.au as of 10 January 2019.
| Fund name (Abbreviated) | % Fund market share this state | % Fund's membership in this state | Agreement hospitals [1] | Fund outlets | ||
|---|---|---|---|---|---|---|
| Private hospitals | Private day hospitals | Retail offices | Agencies | |||
| Open membership funds | ||||||
| Australian Unity | 1.4% | 1.0% | 5 | 7 | ||
| BUPA | 21.9% | 1.7% | 4 | 5 | Yes | |
| CBHS Corporate | 0.0% | 2.5% | 5 | 4 | ||
| CDH | 0.0% | 0.4% | 4 | 3 | ||
| CUA Health | 0.3% | 1.0% | 6 | 7 | Yes | |
| GMHBA | 1.3% | 1.2% | 5 | 4 | ||
| GU Health Corporate | 0.3% | 1.5% | 6 | 7 | ||
| HBF | 1.0% | 0.3% | 4 | 7 | ||
| HCF | 14.6% | 2.8% | 5 | 6 | Yes | |
| HCI | 0.0% | 1.0% | 6 | 8 | ||
| Health.com.au | 0.7% | 2.3% | 6 | 6 | ||
| Health Partners | 0.1% | 0.3% | 5 | 7 | ||
| HIF | 0.3% | 0.8% | 6 | 7 | ||
| Latrobe | 0.1% | 0.4% | 5 | 6 | ||
| MDHF | 0.0% | 0.1% | 5 | 6 | ||
| Medibank | 28.6% | 2.2% | 5 | 4 | Yes | |
| NIB | 15.2% | 3.6% | 6 | 7 | Yes | |
| Onemedifund | 0.0% | 0.2% | 5 | 7 | ||
| Peoplecare | 0.4% | 1.3% | 5 | 7 | ||
| Phoenix | 0.1% | 1.0% | 6 | 7 | ||
| QCH | 0.0% | 0.2% | 5 | 6 | ||
| St Lukes | 0.0% | 0.2% | 5 | 6 | ||
| Transport Health | 0.0% | 0.7% | 5 | 7 | ||
| Westfund | 0.3% | 0.8% | 6 | 7 | ||
| Restricted membership funds | ||||||
| ACA | 0.0% | 0.8% | 6 | 7 | ||
| CBHS | 1.0% | 1.3% | 5 | 4 | ||
| Defence Health | 7.5% | 7.3% | 5 | 7 | Yes | |
| Doctors' Health | 0.4% | 2.5% | 5 | 7 | ||
| Emergency Services | 0.0% | 1.5% | 6 | 7 | ||
| MO Health | 0.08% | 1.9% | 6 | 7 | ||
| Navy Health | 1.4% | 8.7% | 6 | 7 | ||
| Nurses and Midwives | 0.0% | 1.9% | 6 | 7 | ||
| Police | 0.1% | 0.5% | 6 | 7 | ||
| Reserve Bank | 0.0% | 1.3% | 5 | 7 | ||
| RT Health Fund | 0.1% | 0.7% | 5 | 7 | ||
| Teachers Health | 2.6% | 2.2% | 5 | 7 | ||
| TUH | 0.1% | 0.3% | 5 | 7 | ||
[1] Agreement hospitals data is sourced from Privatehealth.gov.au as of 10 January 2019.
| Fund name (Abbreviated) | % Fund market share this state | % Fund's membership in this state | Agreement hospitals [1] | Fund outlets | ||
|---|---|---|---|---|---|---|
| Private hospitals | Private day hospitals | Retail offices | Agencies | |||
| Open membership funds | ||||||
| Australian Unity | 0.5% | 0.1% | 2 | 1 | ||
| BUPA | 37.9% | 1.1% | 1 | 1 | Yes | |
| CBHS Corporate | 0.0% | 0.1% | 1 | 0 | ||
| CDH | 0.0% | 0.0% | 1 | 0 | ||
| CUA Health | 0.1% | 0.2% | 2 | 1 | ||
| GMHBA | 0.3% | 0.1% | 2 | 1 | ||
| GU Health Corporate | 0.1% | 0.2% | 2 | 1 | ||
| HBF | 2.0% | 0.2% | 2 | 1 | ||
| HCF | 5.2% | 0.4% | 1 | 1 | ||
| HCI | 0.0% | 0.1% | 2 | 1 | ||
| Health.com.au | 0.5% | 0.6% | 1 | 1 | ||
| Health Partners | 0.1% | 0.1% | 2 | 1 | ||
| HIF | 0.2% | 0.2% | 2 | 1 | ||
| Latrobe | 0.0% | 0.1% | 1 | 1 | ||
| MDHF | 0.0% | 0.1% | 1 | 1 | ||
| Medibank | 40.2% | 1.2% | 1 | 1 | Yes | |
| NIB | 2.9% | 0.3% | 2 | 1 | ||
| Onemedifund | 0.0% | 0.0% | 2 | 1 | ||
| Peoplecare | 0.1% | 0.1% | 2 | 1 | ||
| Phoenix | 0.0% | 0.2% | 2 | 1 | ||
| QCH | 0.5% | 0.9% | 2 | 1 | ||
| St Lukes | 0.0% | 0.0% | 1 | 1 | ||
| Transport Health | 0.0% | 0.1% | 2 | 1 | ||
| Westfund | 0.1% | 0.1% | 2 | 1 | ||
| Restricted membership funds | ||||||
| ACA | 0.0% | 0.1% | 2 | 1 | ||
| CBHS | 0.4% | 0.2% | 1 | 0 | ||
| Defence Health | 3.9% | 1.4% | 2 | 1 | Yes | |
| Doctors' Health | 0.1% | 0.4% | 2 | 1 | ||
| Emergency Services | 0.1% | 4.1% | 2 | 1 | ||
| MO Health | 0.02% | 0.2% | 2 | 1 | ||
| Navy Health | 0.4% | 1.1% | 2 | 1 | ||
| Nurses and Midwives | 0.0% | 0.4% | 2 | 1 | ||
| Police | 3.1% | 7.4% | 2 | 1 | ||
| Reserve Bank | 0.0% | 0.1% | 2 | 1 | ||
| RT Health Fund | 0.1% | 0.2% | 2 | 1 | ||
| Teachers Health | 0.9% | 0.3% | 2 | 1 | ||
| TUH | 0.1% | 0.1% | 2 | 1 | ||
[1] Agreement hospitals data is sourced from Privatehealth.gov.au as of 10 January 2019.
ABOUT THE PRIVATE HEALTH INSURANCE OMBUDSMAN
The Private Health Insurance Ombudsman (PHIO) protects the interests of people who are covered by private health insurance, through our complaint-handling, consumer information and advice services, as well as advice to government and industry about issues of concern to consumers in relation to private health insurance.
The Private Health Insurance Ombudsman
The PHIO is one of the roles of the Commonwealth Ombudsman. The Ombudsman deals with enquiries and complaints about any aspect of private health insurance. Our Office is independent of the private health funds, private and public hospitals and health service providers.
We deal with complaints about private health insurance, including private health funds, brokers, hospitals, medical practitioners, dentists or other practitioners. Generally, anyone can make a complaint as long as it relates to private health insurance.
How do I make a complaint?
You should first contact your health fund or the organisation or provider you're complaining about—they may be able to resolve your complaint for you.
If your fund doesn't provide a satisfactory response, you can contact us in one of the following ways:
Website: ombudsman.gov.au (including online complaints form)
Call: 1300 362 072
Write: Private Health Insurance Ombudsman, Commonwealth Ombudsman, GPO Box 442, CANBERRA ACT 2601
Email: privatehealthinsuranceombudsman@ombudsman.gov.au
Please include:
- a clear description of your complaint
- the name of your health fund and your membership number
- what you think would resolve the matter for you.
We'll let you know if any other information is needed.
WHAT HAPPENS AFTER I MAKE A COMPLAINT?
Many complaints result from misunderstandings. Your case officer may be able to resolve your complaint by explaining what has happened and why.
Otherwise, we'll contact your health fund or the body you are complaining about to get their explanation and any suggestions they have for fixing the problem. We deal with most complaints by phone or email, and most can be settled quickly.
Where complaints are more complex, we will write to the health fund or other body, seeking further information or recommending a certain course of action. Your case officer will keep you regularly informed, usually by telephone. They will give you their name and contact number in case you need to contact them.
What if I just want some information about health insurance?
You can seek information about private health insurance information by:
- visiting our website privatehealth.gov.au
- calling our Hotline on 1300 737 299, or
- emailing us at privatehealthinsuranceombudsman@ombudsman.gov.au
We also have brochures and publications about private health insurance arrangements which you can find on our website or which we can post on request.
Who can I contact if my complaint is about a medical issue?
Complaints about the quality of service or clinical treatment provided by a health professional or a hospital should be directed to the health care complaints body for your state or territory. These are listed in the state government section of your telephone directory. You can also find a contact list on privatehealth.gov.au under Links.
TEN TIPS FOR AVOIDING HEALTH INSURANCE PROBLEMS
- Consider taking out the highest level of hospital cover you can afford and choosing a higher excess, rather than restrictions or exclusions, to save money on premiums.
- Review your Private Health Information Statement (PHIS) every year. Think about whether your policy will continue to meet your needs over the coming year. This is particularly important if you are thinking about starting a family, or your health needs are changing as you grow older.
- Read all of the information your fund sends you carefully. Important information about your cover will be sent in a personalised letter and should not be ignored.
- Ensure your premiums are up to date. If you pay by direct debit, check your bank or credit card statements every month to ensure payments are being correctly deducted.
- Tell your fund if you change address, add a partner, have a child, or any other circumstance which might affect your cover.
- Make sure you understand any waiting periods, restrictions or limits applying to your cover.
- Contact your fund before you go to hospital to check whether you will be covered and what costs you may need to pay yourself.
- Talk to your doctors about their fees and ask whether they will bill you under your health fund's gap scheme.
- If you decide to change funds, make sure you understand the difference in benefits before changing.
- Visit privatehealth.gov.au for information and advice about private health insurance.
More information can be found in the 'Health Insurance Choice' and 'Ten Golden Rules' brochures, available at privatehealth.gov.au and ombudsman.gov.au.
FOOTNOTES
1 For the purposes of this report, Australian registered private health insurers are referred to as 'health funds'.
2 The 'Operations of the Private Health Insurers' report is available on the APRA website: apra.gov.au.
3 According to privatehealth.gov.au, 10 January 2019, or as supplied by the fund.
4 These agreements do not apply to fees charged by private doctors for in-hospital treatment, these medical fees may be covered by a fund's medical gap scheme arrangements.